SNF 2025 ESG Report
Appendices
Performance data, methodology, GRI index, and assurance
The appendices provide the quantitative data and methodological detail supporting SNF's 2025 ESG disclosures. They include environmental and social performance indicators, calculation boundaries, definitions, the GRI Content Index, and the independent limited assurance report.
2 pagesAppendices Introduction
The appendices document the data, definitions, standards, and assurance processes behind the report. They provide additional detail for stakeholders who need to evaluate SNF's performance and reporting methodology.
Accessible text version of this section
Report page 85
Appendices
Non-financial Performance Indicators Note on Methodology GRI Content Index Independent Limited Assurance Report
4 pagesNon-Financial Performance Indicators
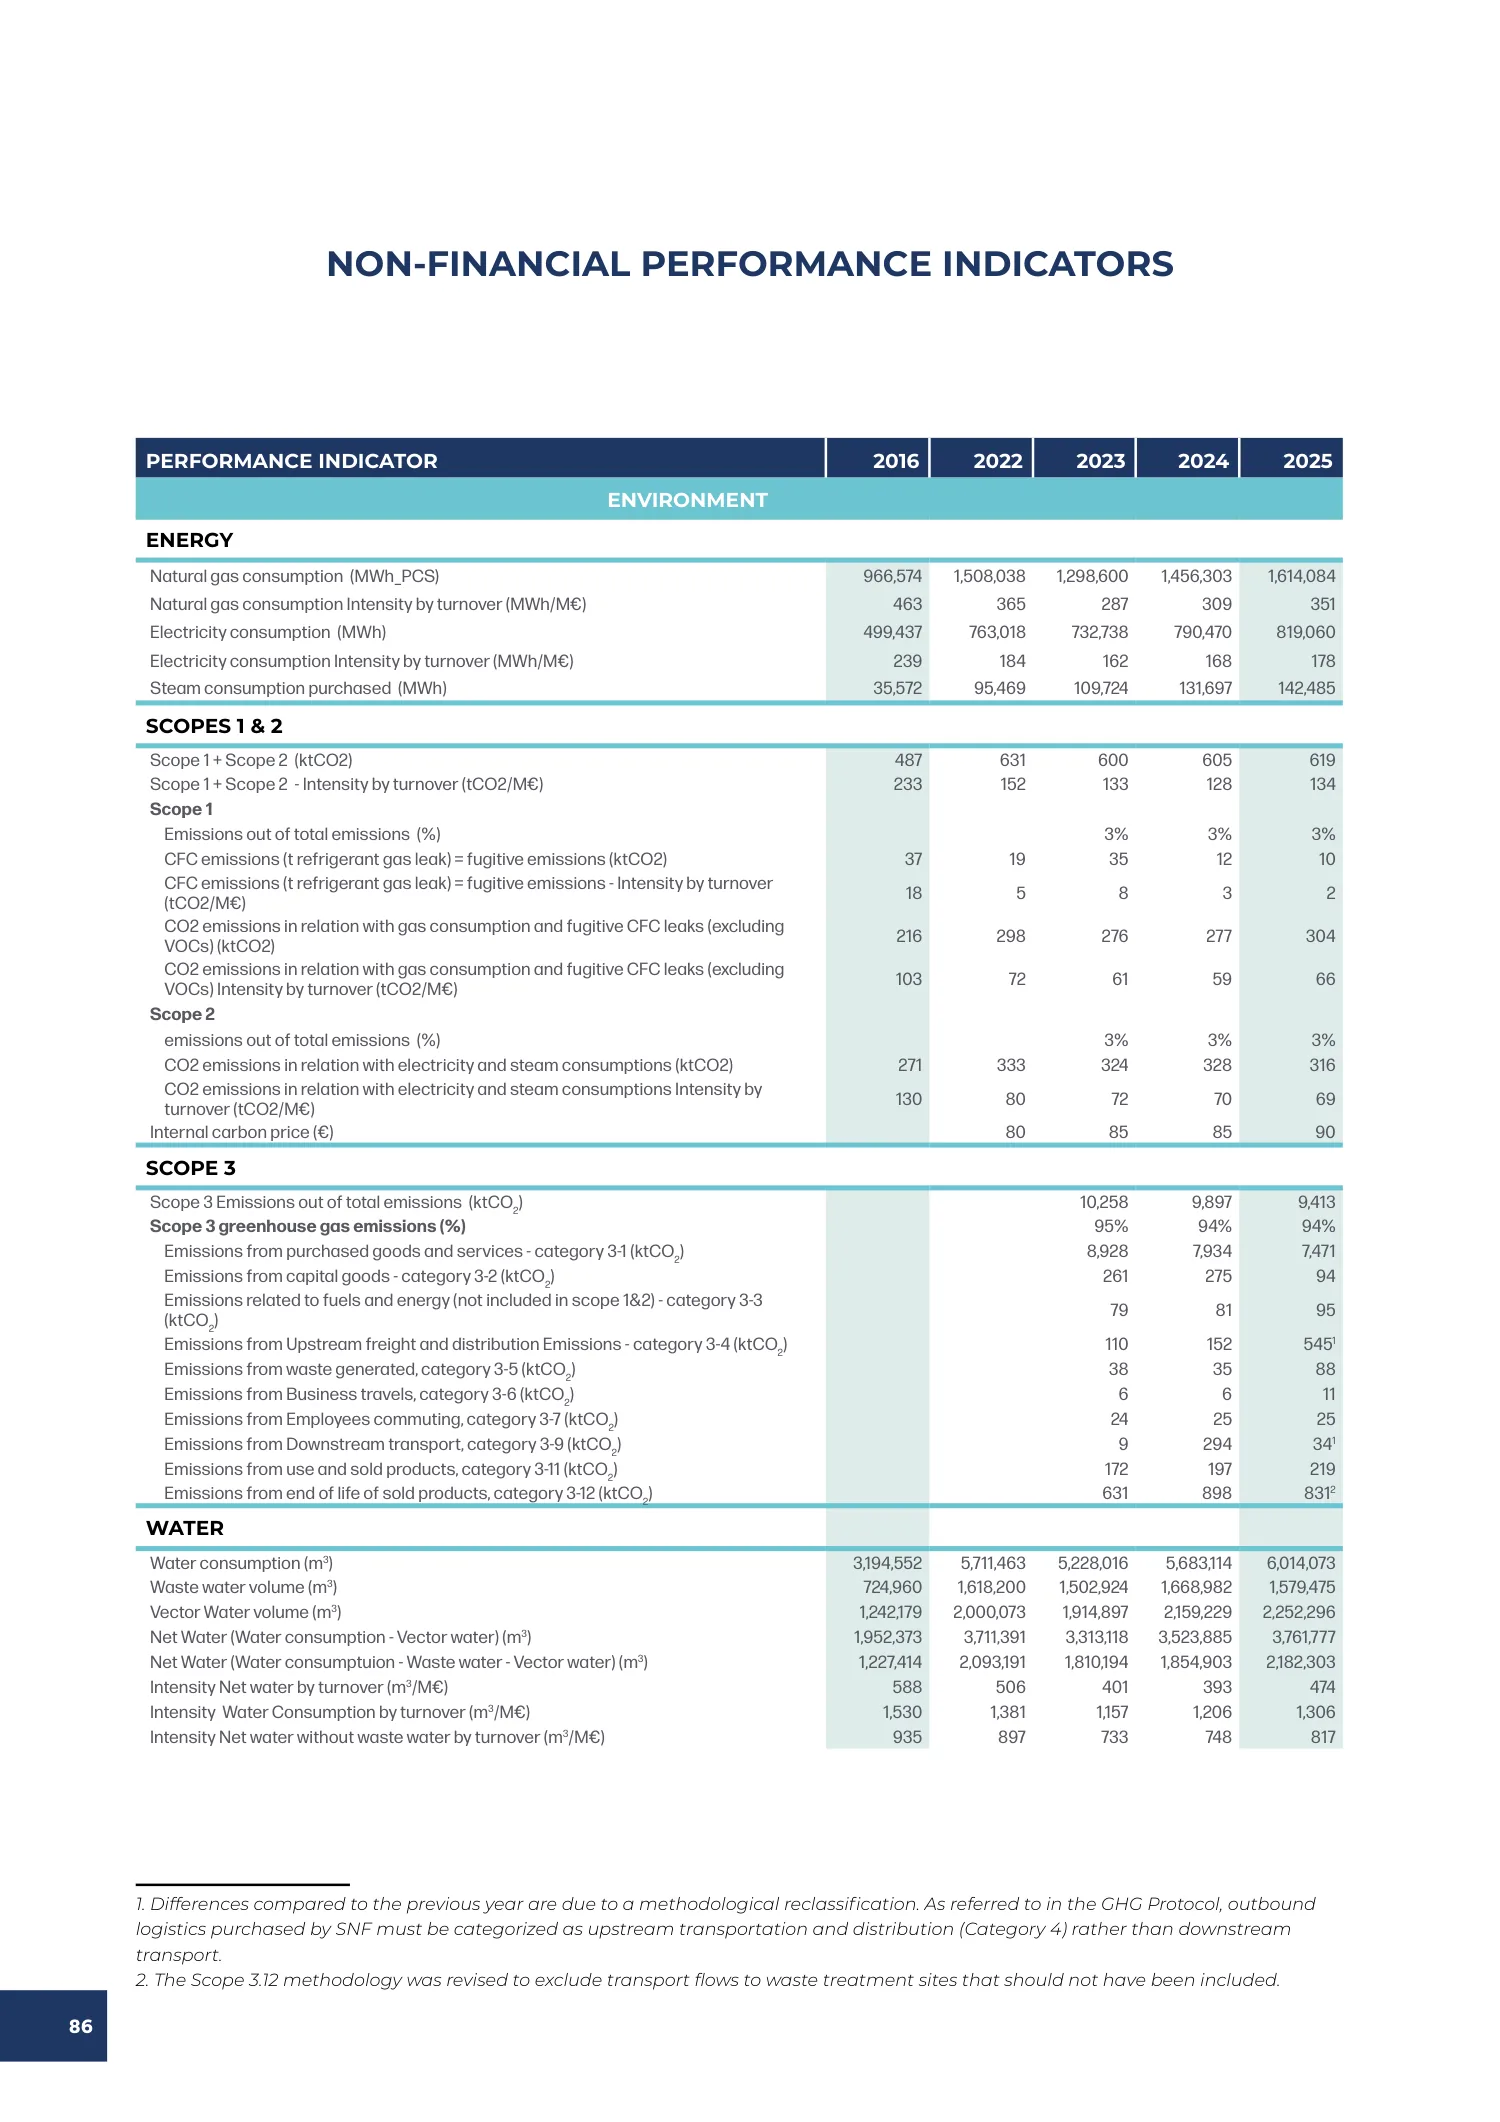
The performance tables present multi-year environmental and social indicators covering energy, greenhouse-gas emissions, water, waste, atmospheric emissions, employees, training, diversity, and safety. Reporting-scope notes identify changes that affect comparisons between years.
Accessible text version of this section
Report page 86
Non-Financial Performance Indicators
| Performance indicator | 2016 | 2022 | 2023 | 2024 | 2025 |
|---|---|---|---|---|---|
| ENERGY | |||||
| Natural gas consumption (MWh PCS) | 966,574 | 1,508,038 | 1,298,600 | 1,456,303 | 1,614,084 |
| Natural gas consumption Intensity by turnover (MWh/M€) | 463 | 365 | 287 | 309 | 351 |
| Electricity consumption (MWh) | 499,437 | 763,018 | 732,738 | 790,470 | 819,060 |
| Electricity consumption Intensity by turnover (MWh/M€) | 239 | 184 | 162 | 168 | 178 |
| Steam consumption purchased (MWh) | 35,572 | 95,469 | 109,724 | 131,697 | 142,485 |
| SCOPES 1 & 2 | |||||
| Scope 1 + Scope 2 (ktCO2) | 487 | 631 | 600 | 605 | 619 |
| Scope 1 + Scope 2 - Intensity by turnover (tCO2/M€) | 233 | 152 | 133 | 128 | 134 |
| Scope 1 | |||||
| Emissions out of total emissions (%) | Not reported | Not reported | 3% | 3% | 3% |
| CFC emissions (t refrigerant gas leak) = fugitive emissions (ktCO2) | 37 | 19 | 35 | 12 | 10 |
| CFC emissions (t refrigerant gas leak) = fugitive emissions - Intensity by turnover (tCO2/M€) | 18 | 5 | 8 | 3 | 2 |
| CO2 emissions in relation with gas consumption and fugitive CFC leaks (excluding VOCs) (ktCO2) | 216 | 298 | 276 | 277 | 304 |
| CO2 emissions in relation with gas consumption and fugitive CFC leaks (excluding VOCs) Intensity by turnover (tCO2/M€) | 103 | 72 | 61 | 59 | 66 |
| Scope 2 | |||||
| emissions out of total emissions (%) | Not reported | Not reported | 3% | 3% | 3% |
| CO2 emissions in relation with electricity and steam consumptions (ktCO2) | 271 | 333 | 324 | 328 | 316 |
| CO2 emissions in relation with electricity and steam consumptions Intensity by turnover (tCO2/M€) | 130 | 80 | 72 | 70 | 69 |
| Internal carbon price (€) | Not reported | 80 | 85 | 85 | 90 |
| SCOPE 3 | |||||
| Scope 3 Emissions out of total emissions (ktCO2) | Not reported | Not reported | 10,258 | 9,897 | 9,413 |
| Scope 3 greenhouse gas emissions (%) | Not reported | Not reported | 95% | 94% | 94% |
| Emissions from purchased goods and services - category 3-1 (ktCO2) | Not reported | Not reported | 8,928 | 7,934 | 7,471 |
| Emissions from capital goods - category 3-2 (ktCO2) | Not reported | Not reported | 261 | 275 | 94 |
| Emissions related to fuels and energy (not included in scope 1&2) - category 3-3 (ktCO2) | Not reported | Not reported | 79 | 81 | 95 |
| Emissions from Upstream freight and distribution Emissions - category 3-4 (ktCO2) | Not reported | Not reported | 110 | 152 | 545 (note 1) |
| Emissions from waste generated, category 3-5 (ktCO2) | Not reported | Not reported | 38 | 35 | 88 |
| Emissions from Business travels, category 3-6 (ktCO2) | Not reported | Not reported | 6 | 6 | 11 |
| Emissions from Employees commuting, category 3-7 (ktCO2) | Not reported | Not reported | 24 | 25 | 25 |
| Emissions from Downstream transport, category 3-9 (ktCO2) | Not reported | Not reported | 9 | 294 | 341 |
| Emissions from use and sold products, category 3-11 (ktCO2) | Not reported | Not reported | 172 | 197 | 219 |
| Emissions from end of life of sold products, category 3-12 (ktCO2) | Not reported | Not reported | 631 | 898 | 831 (note 2) |
| WATER | |||||
| Water consumption (m3) | 3,194,552 | 5,711,463 | 5,228,016 | 5,683,114 | 6,014,073 |
| Waste water volume (m3) | 724,960 | 1,618,200 | 1,502,924 | 1,668,982 | 1,579,475 |
| Vector Water volume (m3) | 1,242,179 | 2,000,073 | 1,914,897 | 2,159,229 | 2,252,296 |
| Net Water (Water consumption - Vector water) (m3) | 1,952,373 | 3,711,391 | 3,313,118 | 3,523,885 | 3,761,777 |
| Net Water (Water consumption - Waste water - Vector water) (m3) | 1,227,414 | 2,093,191 | 1,810,194 | 1,854,903 | 2,182,303 |
| Intensity Net water by turnover (m3/M€) | 588 | 506 | 401 | 393 | 474 |
| Intensity Water Consumption by turnover (m3/M€) | 1,530 | 1,381 | 1,157 | 1,206 | 1,306 |
| Intensity Net water without waste water by turnover (m3/M€) | 935 | 897 | 733 | 748 | 817 |
Notes
- Differences compared with the previous year are due to a methodological reclassification. Under the GHG Protocol, outbound logistics purchased by SNF are categorized as upstream transportation and distribution (Category 4), rather than downstream transport.
- The Scope 3.12 methodology was revised to exclude transport flows to waste-treatment sites that should not have been included.
Report page 87
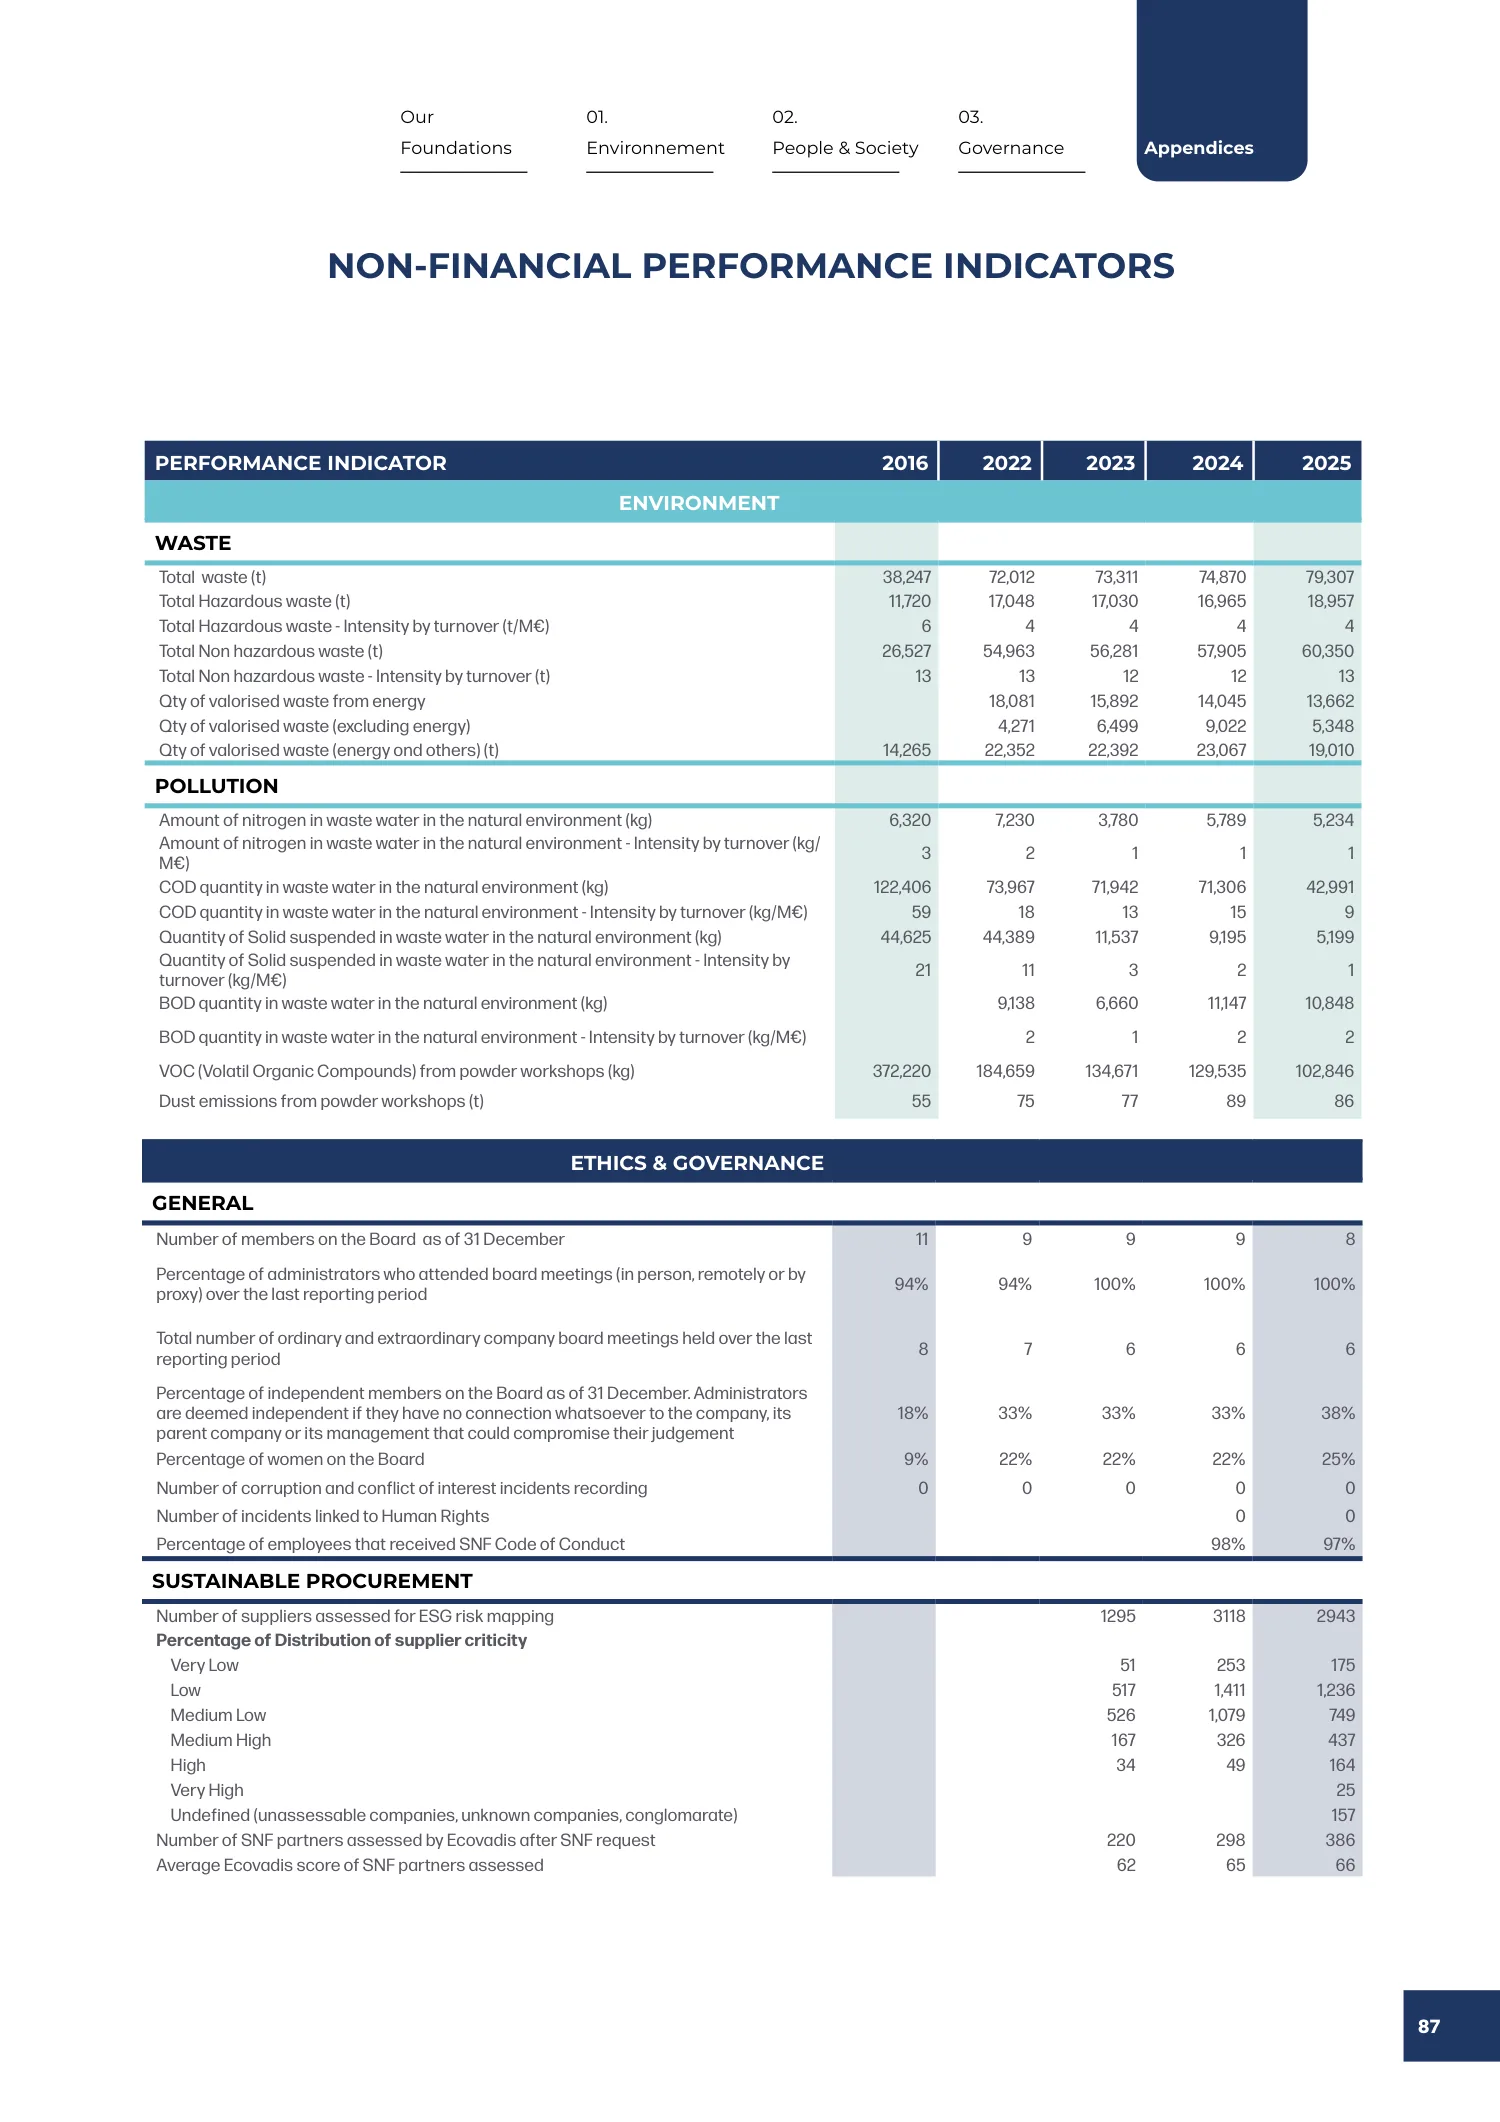
Non-Financial Performance Indicators
| Performance indicator | 2016 | 2022 | 2023 | 2024 | 2025 |
|---|---|---|---|---|---|
| WASTE | |||||
| Total waste (t) | 38,247 | 72,012 | 73,311 | 74,870 | 79,307 |
| Total Hazardous waste (t) | 11,720 | 17,048 | 17,030 | 16,965 | 18,957 |
| Total Hazardous waste - Intensity by turnover (t/M€) | 6 | 4 | 4 | 4 | 4 |
| Total Non hazardous waste (t) | 26,527 | 54,963 | 56,281 | 57,905 | 60,350 |
| Total Non hazardous waste - Intensity by turnover (t) | 13 | 13 | 12 | 12 | 13 |
| Qty of valorised waste from energy | Not reported | 18,081 | 15,892 | 14,045 | 13,662 |
| Qty of valorised waste (excluding energy) | Not reported | 4,271 | 6,499 | 9,022 | 5,348 |
| Qty of valorised waste (energy and others) (t) | 14,265 | 22,352 | 22,392 | 23,067 | 19,010 |
| POLLUTION | |||||
| Amount of nitrogen in waste water in the natural environment (kg) | 6,320 | 7,230 | 3,780 | 5,789 | 5,234 |
| Amount of nitrogen in waste water in the natural environment - Intensity by turnover (kg/ M€) | 3 | 2 | 1 | 1 | 1 |
| COD quantity in waste water in the natural environment (kg) | 122,406 | 73,967 | 71,942 | 71,306 | 42,991 |
| COD quantity in waste water in the natural environment - Intensity by turnover (kg/M€) | 59 | 18 | 13 | 15 | 9 |
| Quantity of Solid suspended in waste water in the natural environment (kg) | 44,625 | 44,389 | 11,537 | 9,195 | 5,199 |
| Quantity of Solid suspended in waste water in the natural environment - Intensity by turnover (kg/M€) | 21 | 11 | 3 | 2 | 1 |
| BOD quantity in waste water in the natural environment (kg) | Not reported | 9,138 | 6,660 | 11,147 | 10,848 |
| BOD quantity in waste water in the natural environment - Intensity by turnover (kg/M€) | Not reported | 2 | 1 | 2 | 2 |
| VOC (Volatile Organic Compounds) from powder workshops (kg) | 372,220 | 184,659 | 134,671 | 129,535 | 102,846 |
| Dust emissions from powder workshops (t) | 55 | 75 | 77 | 89 | 86 |
| ETHICS & GOVERNANCE | |||||
| GENERAL | |||||
| Number of members on the Board as of 31 December | 11 | 9 | 9 | 9 | 8 |
| Percentage of administrators who attended board meetings (in person, remotely or by proxy) over the last reporting period | 94% | 94% | 100% | 100% | 100% |
| Total number of ordinary and extraordinary company board meetings held over the last reporting period | 8 | 7 | 6 | 6 | 6 |
| Percentage of independent members on the Board as of 31 December. Administrators are deemed independent if they have no connection whatsoever to the company, its parent company or its management that could compromise their judgement | 18% | 33% | 33% | 33% | 38% |
| Percentage of women on the Board | 9% | 22% | 22% | 22% | 25% |
| Number of corruption and conflict of interest incidents recording | 0 | 0 | 0 | 0 | 0 |
| Number of incidents linked to Human Rights | Not reported | Not reported | Not reported | 0 | 0 |
| Percentage of employees that received SNF Code of Conduct | Not reported | Not reported | Not reported | 98% | 97% |
| SUSTAINABLE PROCUREMENT | |||||
| Number of suppliers assessed for ESG risk mapping | Not reported | Not reported | 1295 | 3118 | 2943 |
| Percentage of Distribution of supplier criticity | |||||
| Very Low | Not reported | Not reported | 51 | 253 | 175 |
| Low | Not reported | Not reported | 517 | 1,411 | 1,236 |
| Medium Low | Not reported | Not reported | 526 | 1,079 | 749 |
| Medium High | Not reported | Not reported | 167 | 326 | 437 |
| High | Not reported | Not reported | 34 | 49 | 164 |
| Very High | Not reported | Not reported | Not reported | Not reported | 25 |
| Undefined (unassessable companies, unknown companies, conglomerate) | Not reported | Not reported | Not reported | Not reported | 157 |
| Number of SNF partners assessed by Ecovadis after SNF request | Not reported | Not reported | 220 | 298 | 386 |
| Average Ecovadis score of SNF partners assessed | Not reported | Not reported | 62 | 65 | 66 |
Report page 88
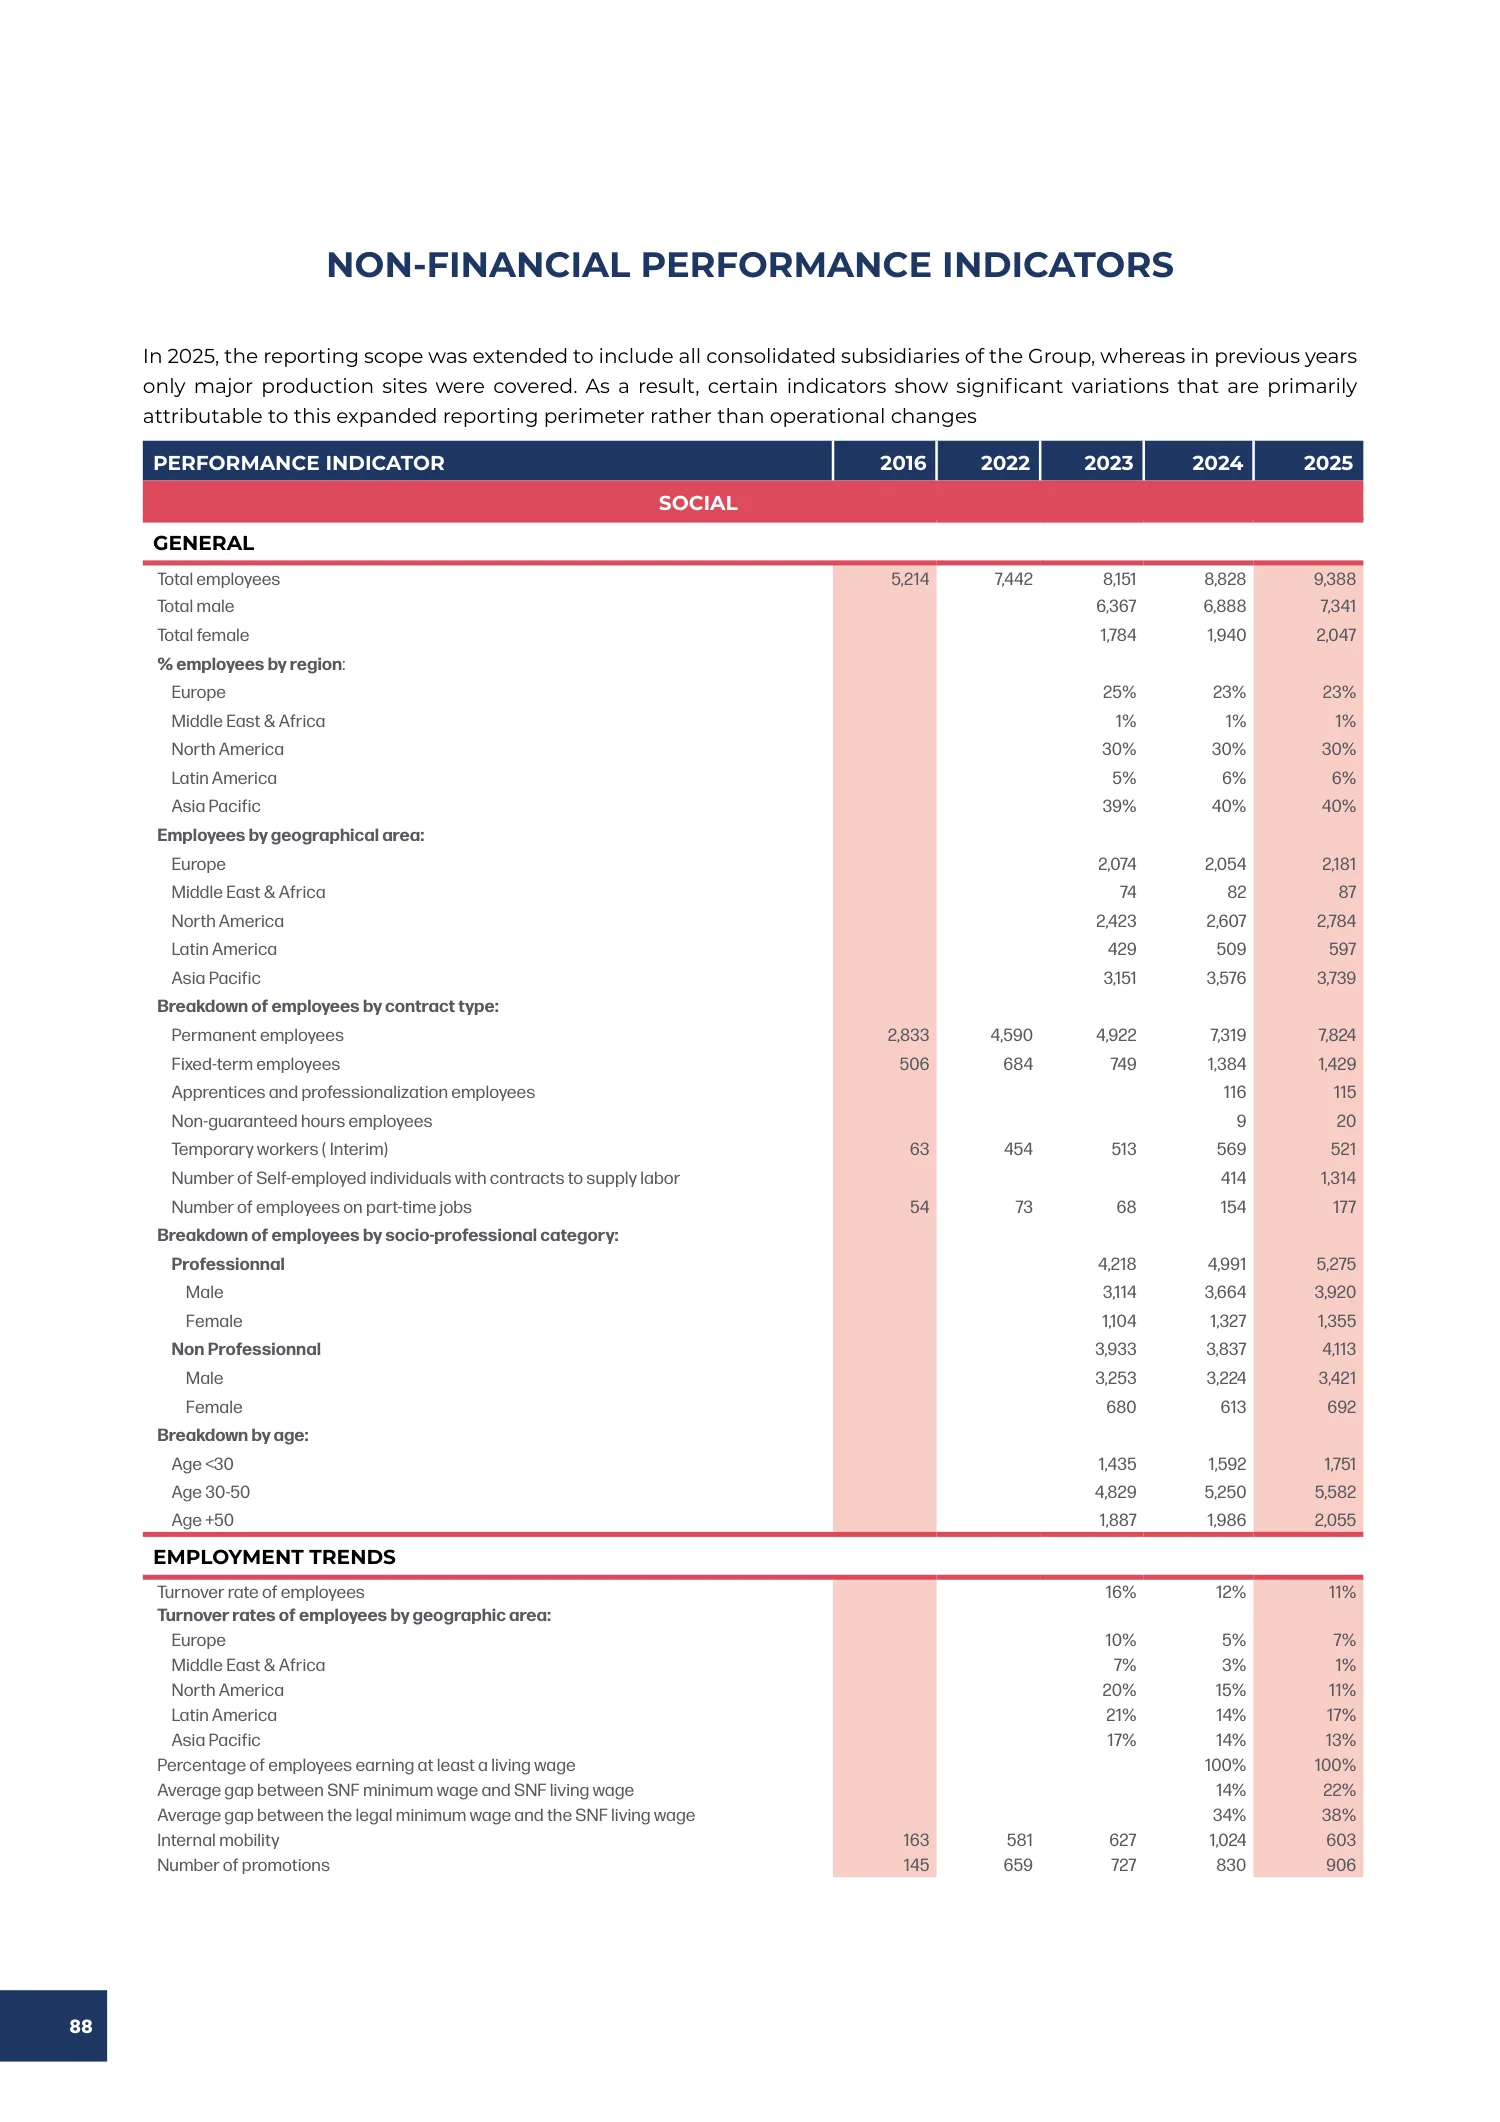
Non-Financial Performance Indicators
In 2025, the reporting scope was extended to include all consolidated subsidiaries of the Group, whereas in previous years only major production sites were covered. As a result, certain indicators show significant variations that are primarily attributable to this expanded reporting perimeter rather than operational changes.
| Performance indicator | 2016 | 2022 | 2023 | 2024 | 2025 |
|---|---|---|---|---|---|
| GENERAL | |||||
| Total employees | 5,214 | 7,442 | 8,151 | 8,828 | 9,388 |
| Total male | Not reported | Not reported | 6,367 | 6,888 | 7,341 |
| Total female | Not reported | Not reported | 1,784 | 1,940 | 2,047 |
| % employees by region: | |||||
| Europe | Not reported | Not reported | 25% | 23% | 23% |
| Middle East & Africa | Not reported | Not reported | 1% | 1% | 1% |
| North America | Not reported | Not reported | 30% | 30% | 30% |
| Latin America | Not reported | Not reported | 5% | 6% | 6% |
| Asia Pacific | Not reported | Not reported | 39% | 40% | 40% |
| Employees by geographical area: | |||||
| Europe | Not reported | Not reported | 2,074 | 2,054 | 2,181 |
| Middle East & Africa | Not reported | Not reported | 74 | 82 | 87 |
| North America | Not reported | Not reported | 2,423 | 2,607 | 2,784 |
| Latin America | Not reported | Not reported | 429 | 509 | 597 |
| Asia Pacific | Not reported | Not reported | 3,151 | 3,576 | 3,739 |
| Breakdown of employees by contract type: | |||||
| Permanent employees | 2,833 | 4,590 | 4,922 | 7,319 | 7,824 |
| Fixed-term employees | 506 | 684 | 749 | 1,384 | 1,429 |
| Apprentices and professionalization employees | Not reported | Not reported | Not reported | 116 | 115 |
| Non-guaranteed hours employees | Not reported | Not reported | Not reported | 9 | 20 |
| Temporary workers ( interim) | 63 | 454 | 513 | 569 | 521 |
| Number of Self-employed individuals with contracts to supply labor | Not reported | Not reported | Not reported | 414 | 1,314 |
| Number of employees on part-time jobs | 54 | 73 | 68 | 154 | 177 |
| Breakdown of employees by socio-professional category: | |||||
| Professional | Not reported | Not reported | 4,218 | 4,991 | 5,275 |
| Male | Not reported | Not reported | 3,114 | 3,664 | 3,920 |
| Female | Not reported | Not reported | 1,104 | 1,327 | 1,355 |
| Non-professional | Not reported | Not reported | 3,933 | 3,837 | 4,113 |
| Male | Not reported | Not reported | 3,253 | 3,224 | 3,421 |
| Female | Not reported | Not reported | 680 | 613 | 692 |
| Breakdown by age: | |||||
| Age <30 | Not reported | Not reported | 1,435 | 1,592 | 1,751 |
| Age 30-50 | Not reported | Not reported | 4,829 | 5,250 | 5,582 |
| Age +50 | Not reported | Not reported | 1,887 | 1,986 | 2,055 |
| EMPLOYMENT TRENDS | |||||
| Turnover rate of employees | Not reported | Not reported | 16% | 12% | 11% |
| Turnover rates of employees by geographic area: | |||||
| Europe | Not reported | Not reported | 10% | 5% | 7% |
| Middle East & Africa | Not reported | Not reported | 7% | 3% | 1% |
| North America | Not reported | Not reported | 20% | 15% | 11% |
| Latin America | Not reported | Not reported | 21% | 14% | 17% |
| Asia Pacific | Not reported | Not reported | 17% | 14% | 13% |
| Percentage of employees earning at least a living wage | Not reported | Not reported | Not reported | 100% | 100% |
| Average gap between SNF minimum wage and SNF living wage | Not reported | Not reported | Not reported | 14% | 22% |
| Average gap between the legal minimum wage and the SNF living wage | Not reported | Not reported | Not reported | 34% | 38% |
| Internal mobility | 163 | 581 | 627 | 1,024 | 603 |
| Number of promotions | 145 | 659 | 727 | 830 | 906 |
Report page 89
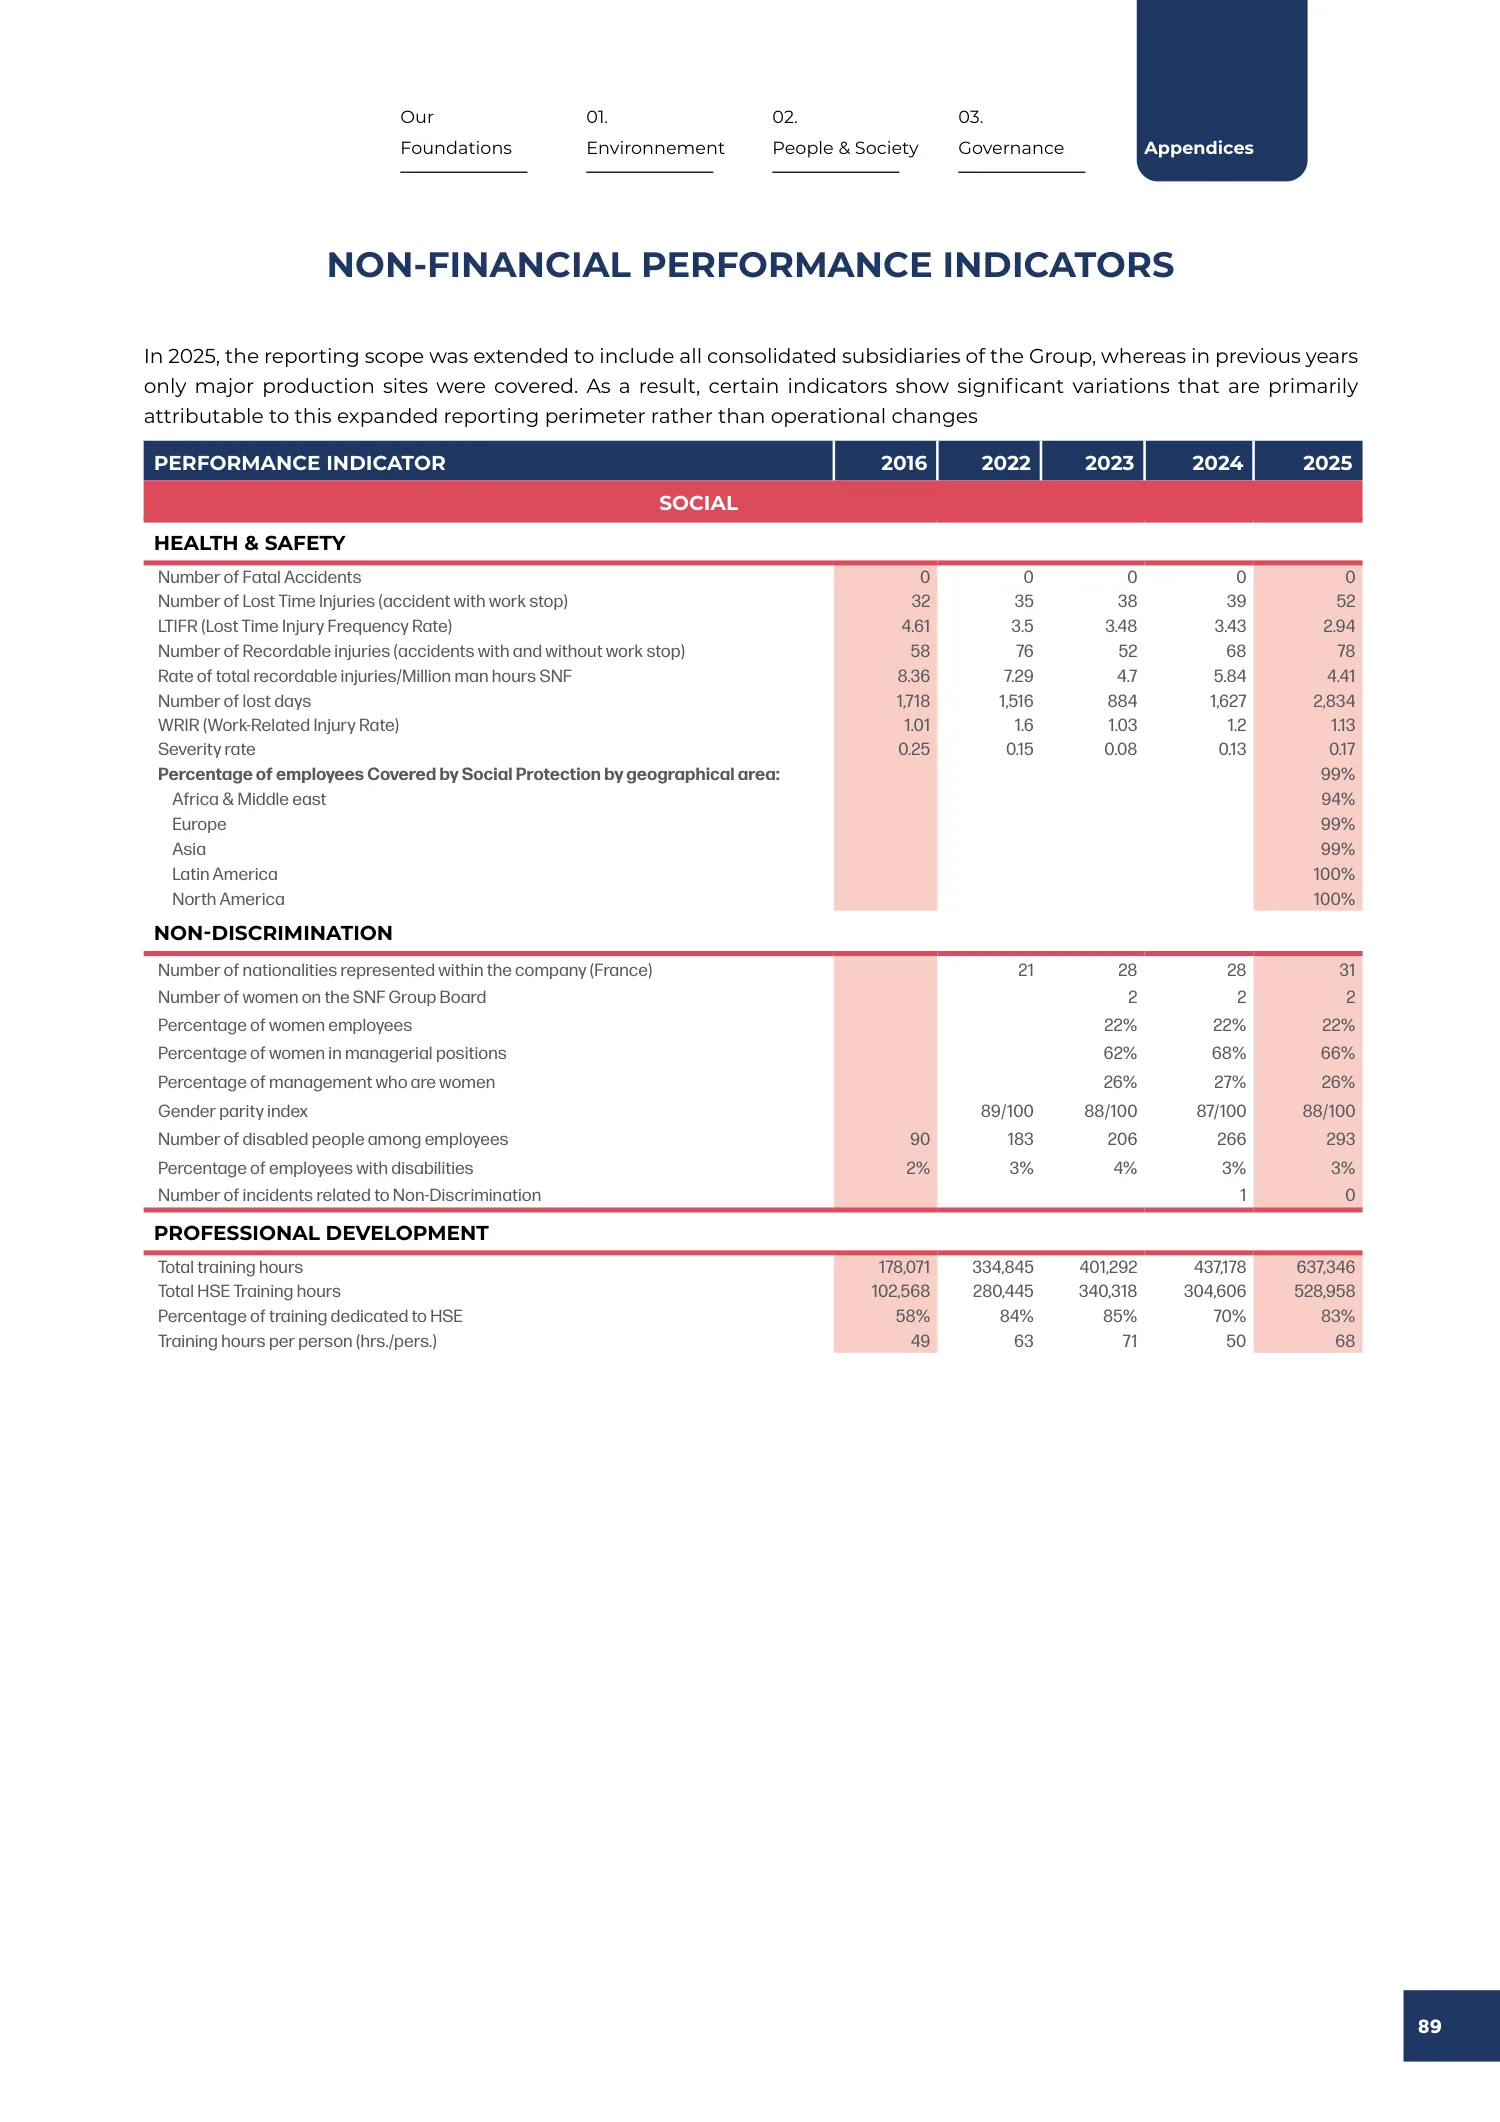
Non-Financial Performance Indicators
In 2025, the reporting scope was extended to include all consolidated subsidiaries of the Group, whereas in previous years only major production sites were covered. As a result, certain indicators show significant variations that are primarily attributable to this expanded reporting perimeter rather than operational changes.
| Performance indicator | 2016 | 2022 | 2023 | 2024 | 2025 |
|---|---|---|---|---|---|
| HEALTH & SAFETY | |||||
| Number of Fatal Accidents | 0 | 0 | 0 | 0 | 0 |
| Number of Lost Time Injuries (accident with work stop) | 32 | 35 | 38 | 39 | 52 |
| LTIFR (Lost Time Injury Frequency Rate) | 4.61 | 3.5 | 3.48 | 3.43 | 2.94 |
| Number of Recordable injuries (accidents with and without work stop) | 58 | 76 | 52 | 68 | 78 |
| Rate of total recordable injuries/Million man hours SNF | 8.36 | 7.29 | 4.7 | 5.84 | 4.41 |
| Number of lost days | 1,718 | 1,516 | 884 | 1,627 | 2,834 |
| WRIR (Work-Related Injury Rate) | 1.01 | 1.6 | 1.03 | 1.2 | 1.13 |
| Severity rate | 0.25 | 0.15 | 0.08 | 0.13 | 0.17 |
| Percentage of employees Covered by Social Protection by geographical area: | Not reported | Not reported | Not reported | Not reported | 99% |
| Africa & Middle east | Not reported | Not reported | Not reported | Not reported | 94% |
| Europe | Not reported | Not reported | Not reported | Not reported | 99% |
| Asia | Not reported | Not reported | Not reported | Not reported | 99% |
| Latin America | Not reported | Not reported | Not reported | Not reported | 100% |
| North America | Not reported | Not reported | Not reported | Not reported | 100% |
| NON-DISCRIMINATION | |||||
| Number of nationalities represented within the company (France) | Not reported | 21 | 28 | 28 | 31 |
| Number of women on the SNF Group Board | Not reported | Not reported | 2 | 2 | 2 |
| Percentage of women employees | Not reported | Not reported | 22% | 22% | 22% |
| Percentage of women in managerial positions | Not reported | Not reported | 62% | 68% | 66% |
| Percentage of management who are women | Not reported | Not reported | 26% | 27% | 26% |
| Gender parity index | Not reported | 89/100 | 88/100 | 87/100 | 88/100 |
| Number of disabled people among employees | 90 | 183 | 206 | 266 | 293 |
| Percentage of employees with disabilities | 2% | 3% | 4% | 3% | 3% |
| Number of incidents related to Non-Discrimination | Not reported | Not reported | Not reported | 1 | 0 |
| PROFESSIONAL DEVELOPMENT | |||||
| Total training hours | 178,071 | 334,845 | 401,292 | 437,178 | 637,346 |
| Total HSE Training hours | 102,568 | 280,445 | 340,318 | 304,606 | 528,958 |
| Percentage of training dedicated to HSE | 58% | 84% | 85% | 70% | 83% |
| Training hours per person (hrs./pers.) | 49 | 63 | 71 | 50 | 68 |
10 pagesNote on Methodology
The methodology defines reporting boundaries, consolidation rules, calculations, units, assumptions, and indicator-specific treatment. It explains environmental measures for energy, water, waste, emissions, and greenhouse gases as well as social measures for employment, training, diversity, wages, and safety.
Accessible text version of this section
Report page 90
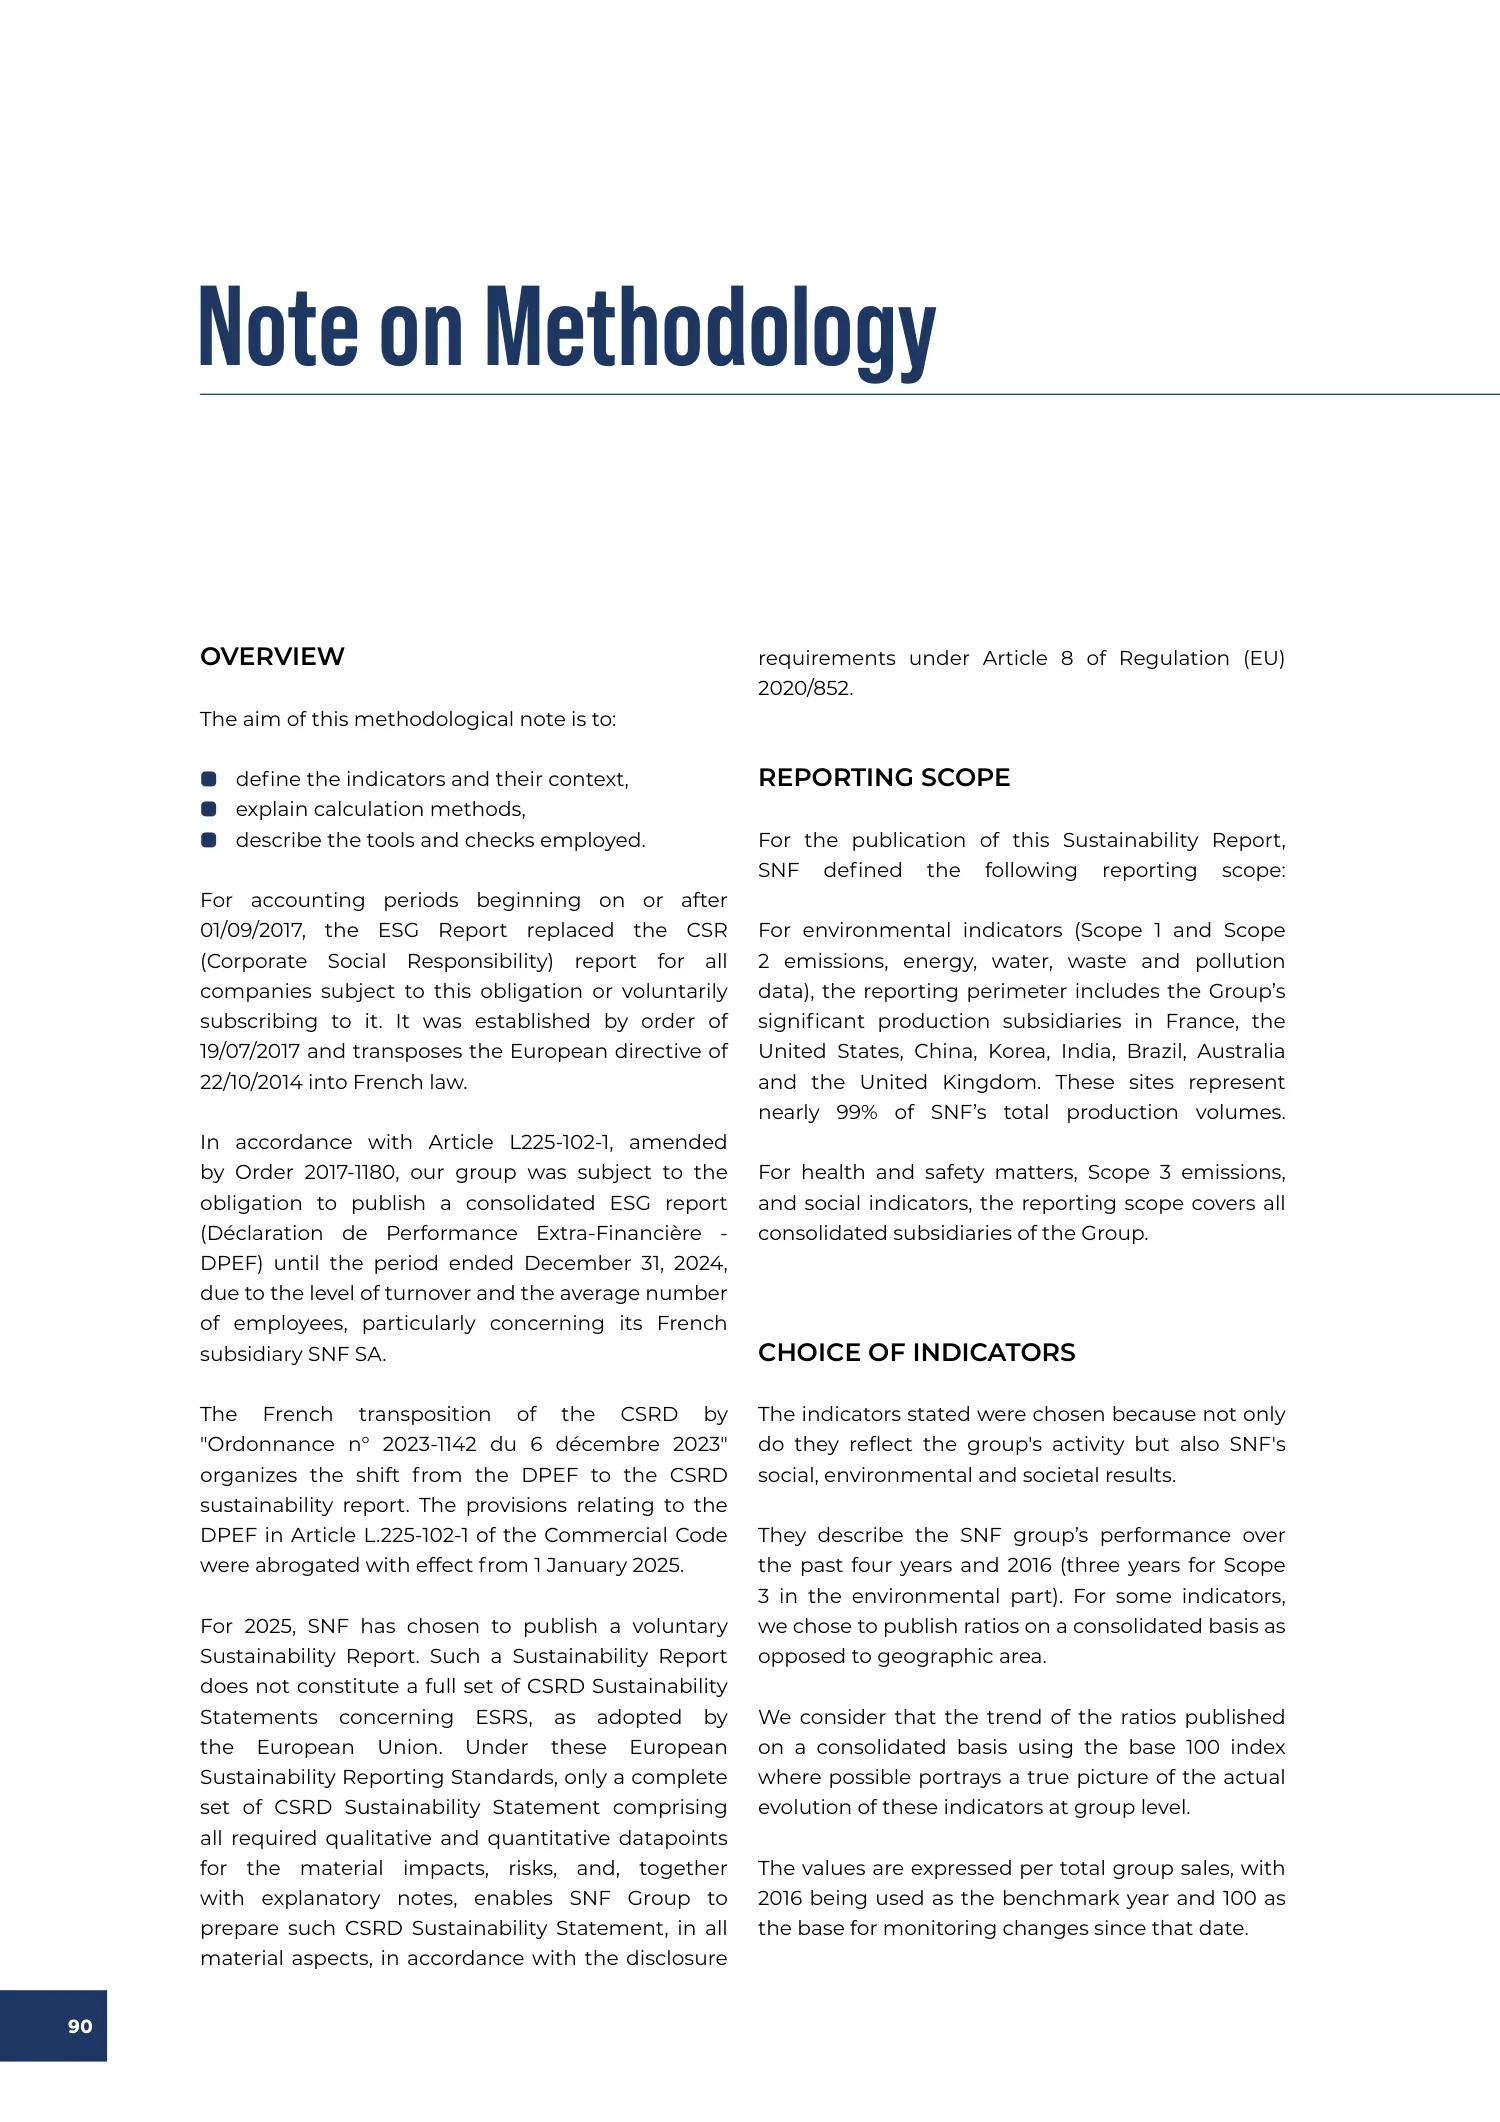
Note on Methodology
OVERVIEW
The aim of this methodological note is to:
• define the indicators and their context,
• explain calculation methods,
• describe the tools and checks employed.
For accounting periods beginning on or after 01/09/2017, the ESG Report replaced the CSR (Corporate Social Responsibility) report for all companies subject to this obligation or voluntarily subscribing to it. It was established by order of 19/07/2017 and transposes the European directive of 22/10/2014 into French law.
In accordance with Article L225-102-1, amended by Order 2017-1180, our group was subject to the obligation to publish a consolidated ESG report (Déclaration de Performance Extra-Financière -DPEF) until the period ended December 31, 2024, due to the level of turnover and the average number of employees, particularly concerning its French subsidiary SNF SA.
The French transposition of the CSRD by "Ordonnance n° 2023-1142 du 6 décembre 2023" organizes the shift from the DPEF to the CSRD sustainability report. The provisions relating to the DPEF in Article L.225-102-1 of the Commercial Code were abrogated with effect from 1 January 2025.
For 2025, SNF has chosen to publish a voluntary Sustainability Report. Such a Sustainability Report does not constitute a full set of CSRD Sustainability Statements concerning ESRS, as adopted by the European Union. Under these European Sustainability Reporting Standards, only a complete set of CSRD Sustainability Statement comprising all required qualitative and quantitative datapoints for the material impacts, risks, and, together with explanatory notes, enables SNF Group to prepare such CSRD Sustainability Statement, in all material aspects, in accordance with the disclosure
requirements under Article 8 of Regulation (EU) 2020/852.
REPORTING SCOPE
For the publication of this Sustainability Report, SNF defined the following reporting scope: For environmental indicators (Scope 1 and Scope 2 emissions, energy, water, waste and pollution data), the reporting perimeter includes the Group’s significant production subsidiaries in France, the United States, China, Korea, India, Brazil, Australia and the United Kingdom. These sites represent nearly 99% of SNF’s total production volumes. For health and safety matters, Scope 3 emissions, and social indicators, the reporting scope covers all consolidated subsidiaries of the Group.
CHOICE OF INDICATORS
The indicators stated were chosen because not only do they reflect the group's activity but also SNF's social, environmental and societal results.
They describe the SNF group’s performance over the past four years and 2016 (three years for Scope 3 in the environmental part). For some indicators, we chose to publish ratios on a consolidated basis as opposed to geographic area.
We consider that the trend of the ratios published on a consolidated basis using the base 100 index where possible portrays a true picture of the actual evolution of these indicators at group level.
The values are expressed per total group sales, with 2016 being used as the benchmark year and 100 as the base for monitoring changes since that date.
Report page 91
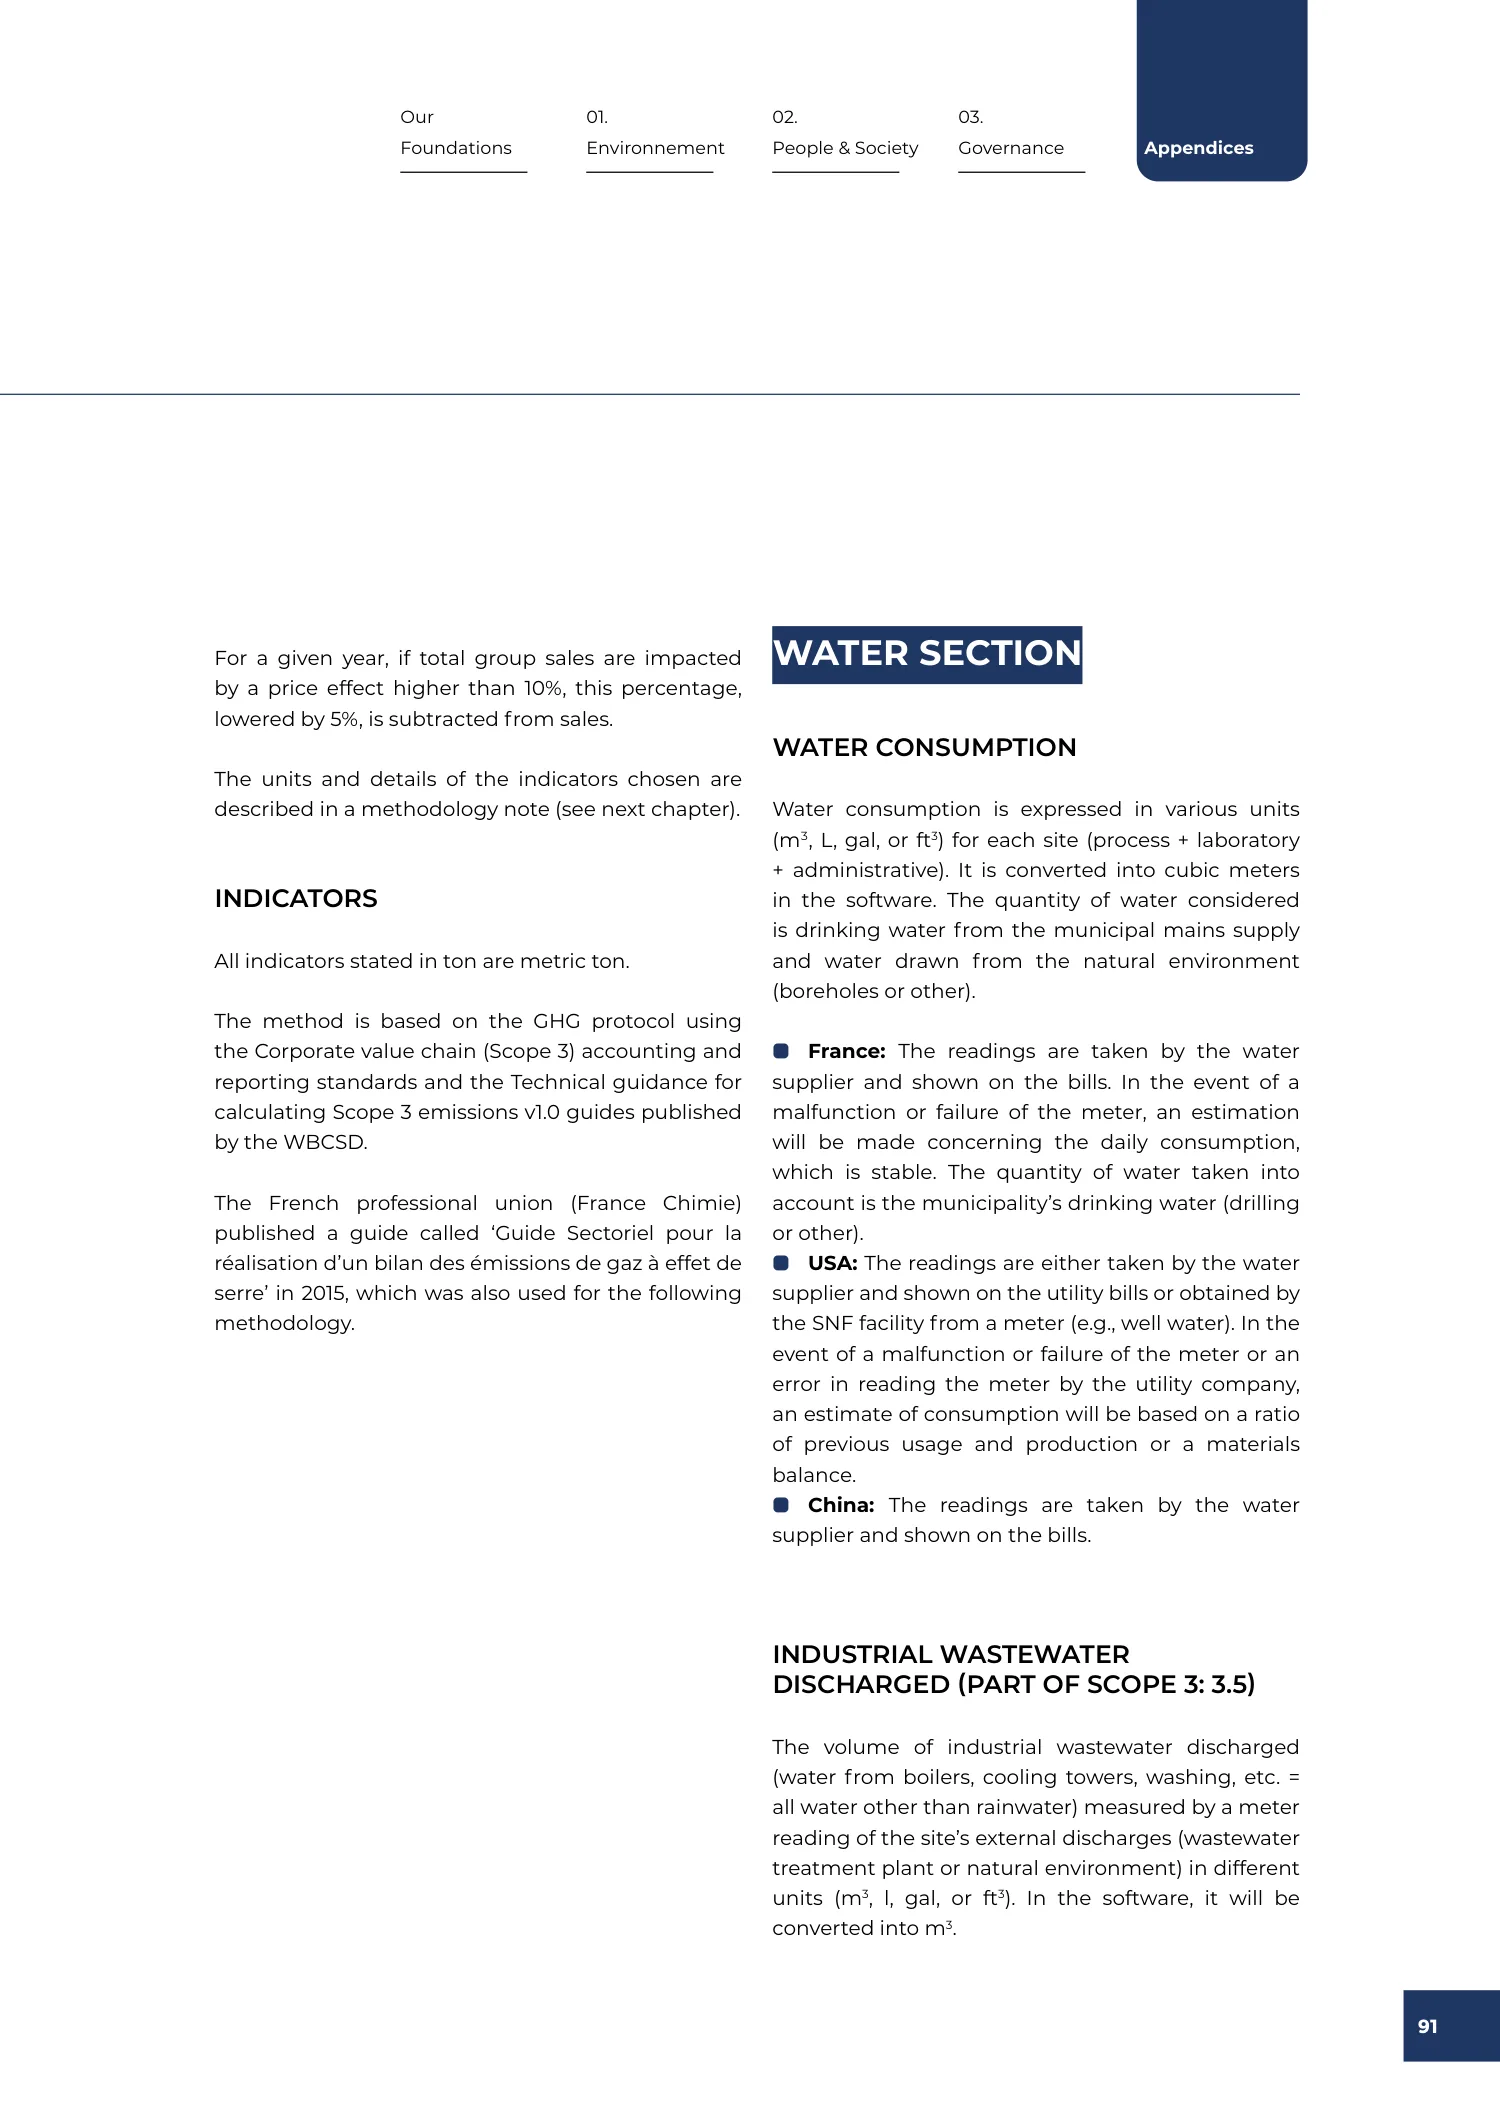
For a given year, if total group sales are impacted by a price effect higher than 10%, this percentage, lowered by 5%, is subtracted from sales.
The units and details of the indicators chosen are described in a methodology note (see next chapter).
INDICATORS
All indicators stated in ton are metric ton.
The method is based on the GHG protocol using the Corporate value chain (Scope 3) accounting and reporting standards and the Technical guidance for calculating Scope 3 emissions v1.0 guides published by the WBCSD.
The French professional union (France Chimie) published a guide called ‘Guide Sectoriel pour la réalisation d’un bilan des émissions de gaz à effet de serre’ in 2015, which was also used for the following methodology.
WATER SECTION
WATER CONSUMPTION
Water consumption is expressed in various units (m3, L, gal, or ft3) for each site (process + laboratory + administrative). It is converted into cubic meters in the software. The quantity of water considered is drinking water from the municipal mains supply and water drawn from the natural environment (boreholes or other).
• France: The readings are taken by the water supplier and shown on the bills. In the event of a malfunction or failure of the meter, an estimation will be made concerning the daily consumption, which is stable. The quantity of water taken into account is the municipality’s drinking water (drilling or other).
• USA: The readings are either taken by the water supplier and shown on the utility bills or obtained by the SNF facility from a meter (e.g., well water). In the event of a malfunction or failure of the meter or an error in reading the meter by the utility company, an estimate of consumption will be based on a ratio of previous usage and production or a materials balance.
• China: The readings are taken by the water supplier and shown on the bills.
INDUSTRIAL WASTEWATER DISCHARGED (PART OF SCOPE 3: 3.5)
The volume of industrial wastewater discharged (water from boilers, cooling towers, washing, etc. = all water other than rainwater) measured by a meter reading of the site’s external discharges (wastewater treatment plant or natural environment) in different units (m3, l, gal, or ft3). In the software, it will be converted into m3.
Report page 92
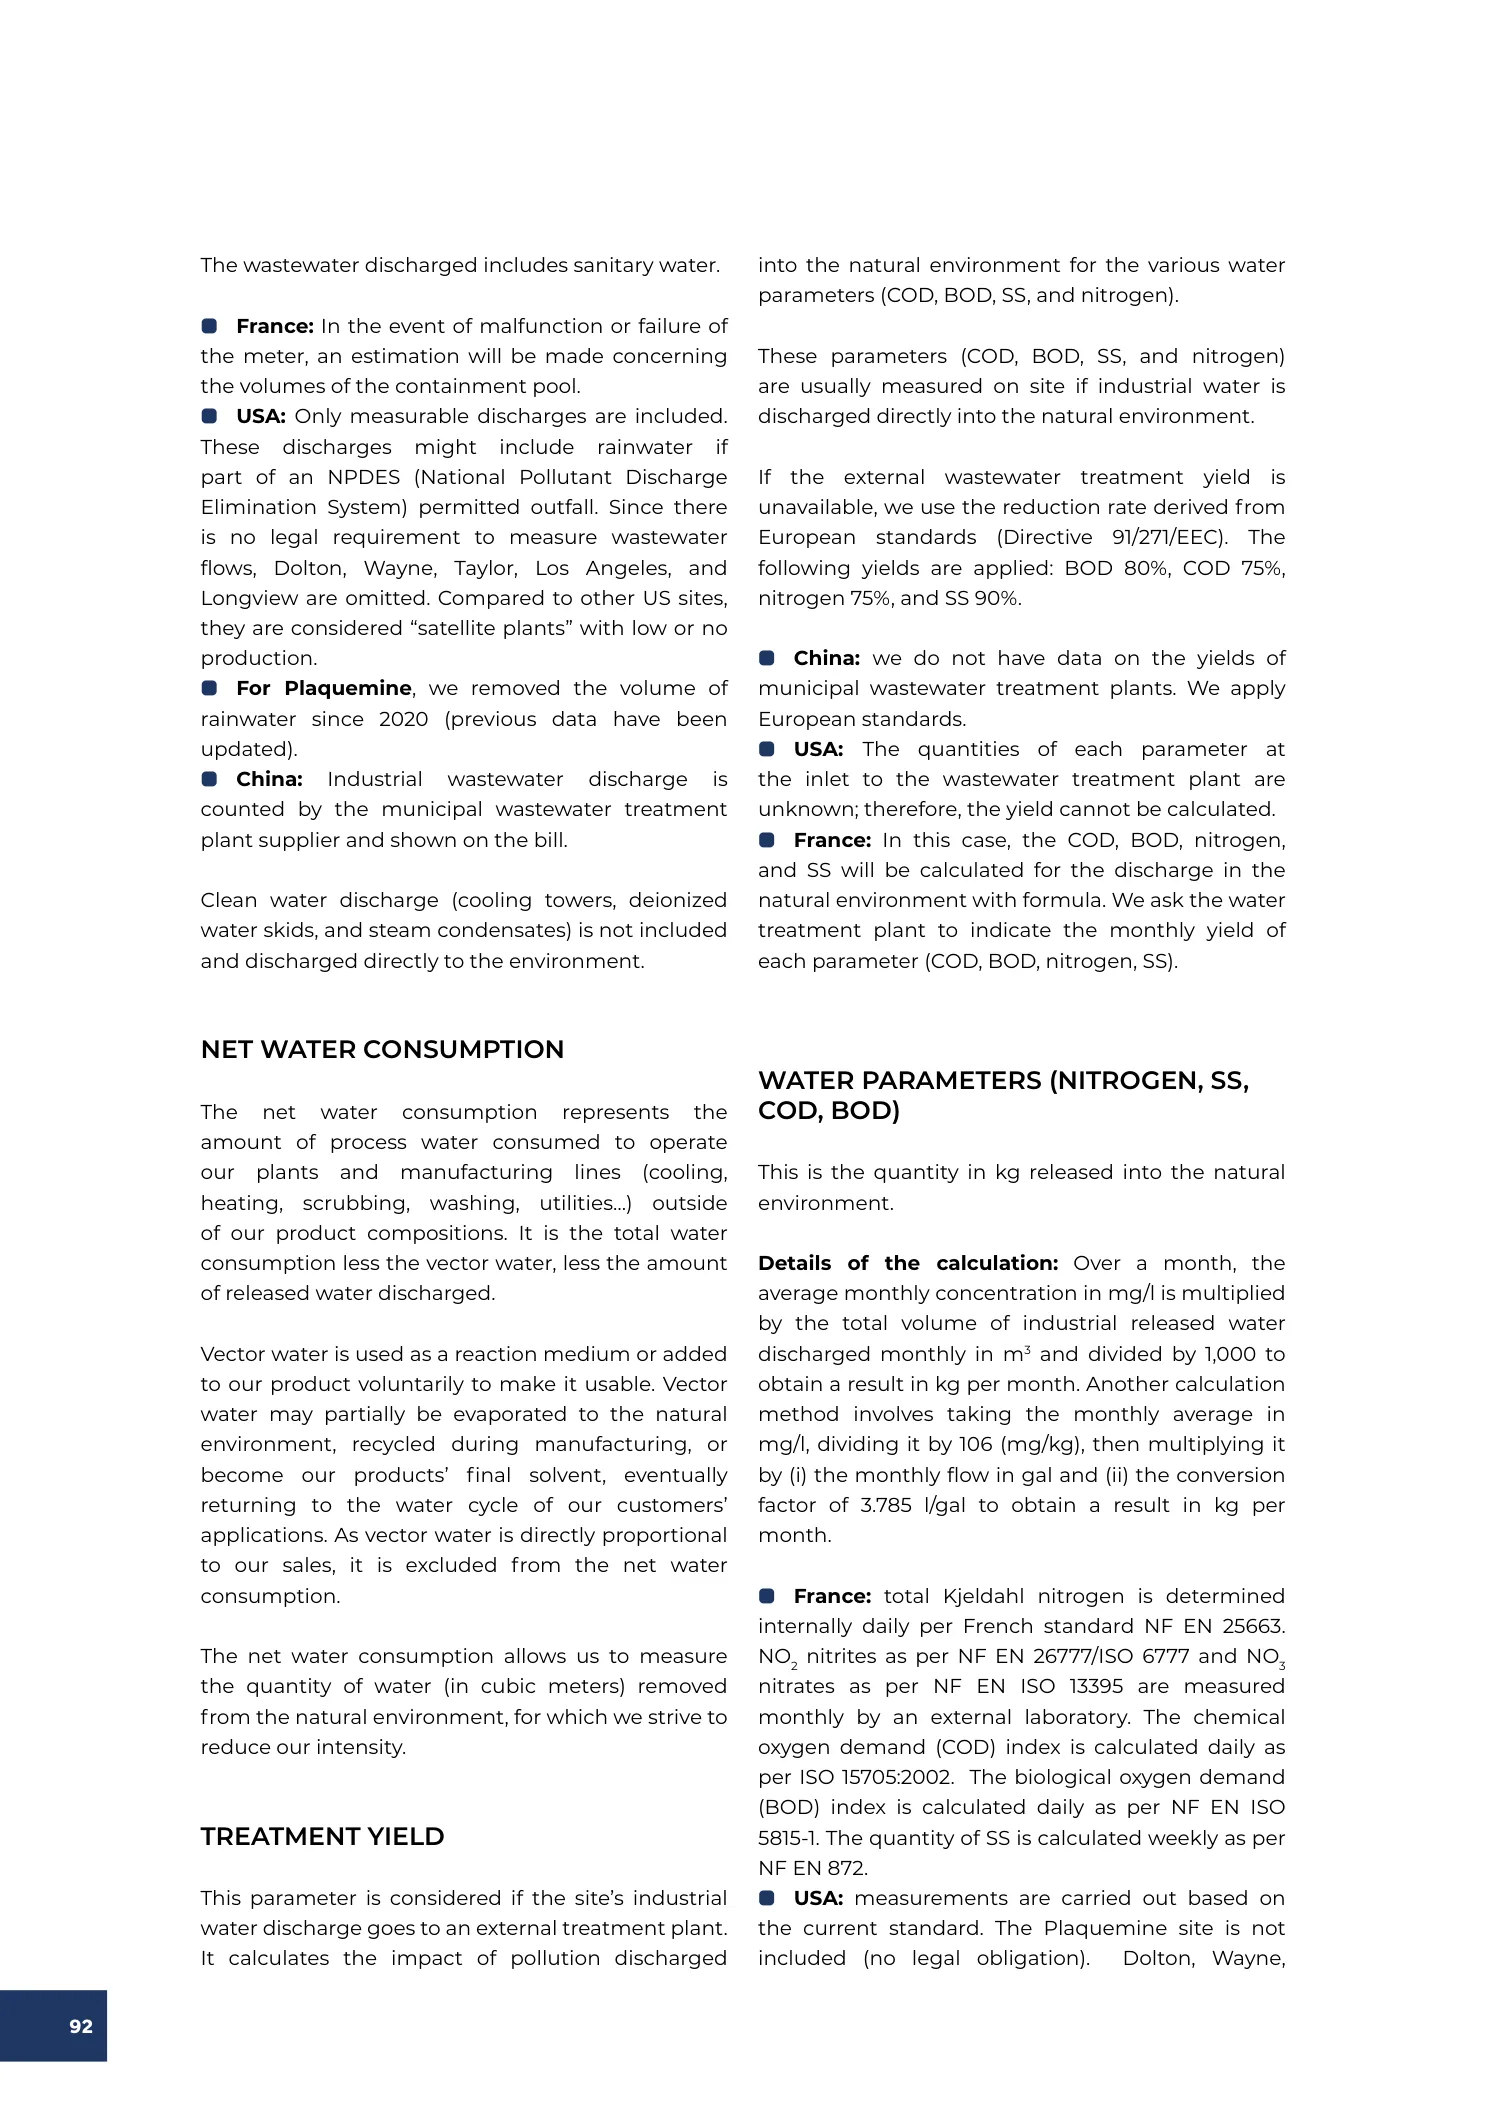
The wastewater discharged includes sanitary water.
• France: In the event of malfunction or failure of the meter, an estimation will be made concerning the volumes of the containment pool.
• USA: Only measurable discharges are included. These discharges might include rainwater if part of an NPDES (National Pollutant Discharge Elimination System) permitted outfall. Since there is no legal requirement to measure wastewater flows, Dolton, Wayne, Taylor, Los Angeles, and Longview are omitted. Compared to other US sites, they are considered “satellite plants” with low or no production.
• For Plaquemine, we removed the volume of rainwater since 2020 (previous data have been updated).
• China: Industrial wastewater discharge is counted by the municipal wastewater treatment plant supplier and shown on the bill.
Clean water discharge (cooling towers, deionized water skids, and steam condensates) is not included and discharged directly to the environment.
NET WATER CONSUMPTION
The net water consumption represents the amount of process water consumed to operate our plants and manufacturing lines (cooling, heating, scrubbing, washing, utilities…) outside of our product compositions. It is the total water consumption less the vector water, less the amount of released water discharged.
Vector water is used as a reaction medium or added to our product voluntarily to make it usable. Vector water may partially be evaporated to the natural environment, recycled during manufacturing, or become our products’ final solvent, eventually returning to the water cycle of our customers’ applications. As vector water is directly proportional to our sales, it is excluded from the net water consumption.
The net water consumption allows us to measure the quantity of water (in cubic meters) removed from the natural environment, for which we strive to reduce our intensity.
TREATMENT YIELD
This parameter is considered if the site’s industrial water discharge goes to an external treatment plant. It calculates the impact of pollution discharged
into the natural environment for the various water parameters (COD, BOD, SS, and nitrogen).
These parameters (COD, BOD, SS, and nitrogen) are usually measured on site if industrial water is discharged directly into the natural environment.
If the external wastewater treatment yield is unavailable, we use the reduction rate derived from European standards (Directive 91/271/EEC). The following yields are applied: BOD 80%, COD 75%, nitrogen 75%, and SS 90%.
• China: we do not have data on the yields of municipal wastewater treatment plants. We apply European standards.
• USA: The quantities of each parameter at the inlet to the wastewater treatment plant are unknown; therefore, the yield cannot be calculated.
• France: In this case, the COD, BOD, nitrogen, and SS will be calculated for the discharge in the natural environment with formula. We ask the water treatment plant to indicate the monthly yield of each parameter (COD, BOD, nitrogen, SS).
WATER PARAMETERS (NITROGEN, SS, COD, BOD)
This is the quantity in kg released into the natural environment.
Details of the calculation: Over a month, the average monthly concentration in mg/l is multiplied by the total volume of industrial released water discharged monthly in m3 and divided by 1,000 to obtain a result in kg per month. Another calculation method involves taking the monthly average in mg/l, dividing it by 106 (mg/kg), then multiplying it by (i) the monthly flow in gal and (ii) the conversion factor of 3.785 l/gal to obtain a result in kg per month.
• France: total Kjeldahl nitrogen is determined internally daily per French standard NF EN 25663. NO2 nitrites as per NF EN 26777/ISO 6777 and NO3 nitrates as per NF EN ISO 13395 are measured monthly by an external laboratory. The chemical oxygen demand (COD) index is calculated daily as per ISO 15705:2002. The biological oxygen demand (BOD) index is calculated daily as per NF EN ISO 5815-1. The quantity of SS is calculated weekly as per NF EN 872.
• USA: measurements are carried out based on the current standard. The Plaquemine site is not included (no legal obligation). Dolton, Wayne,
Report page 93
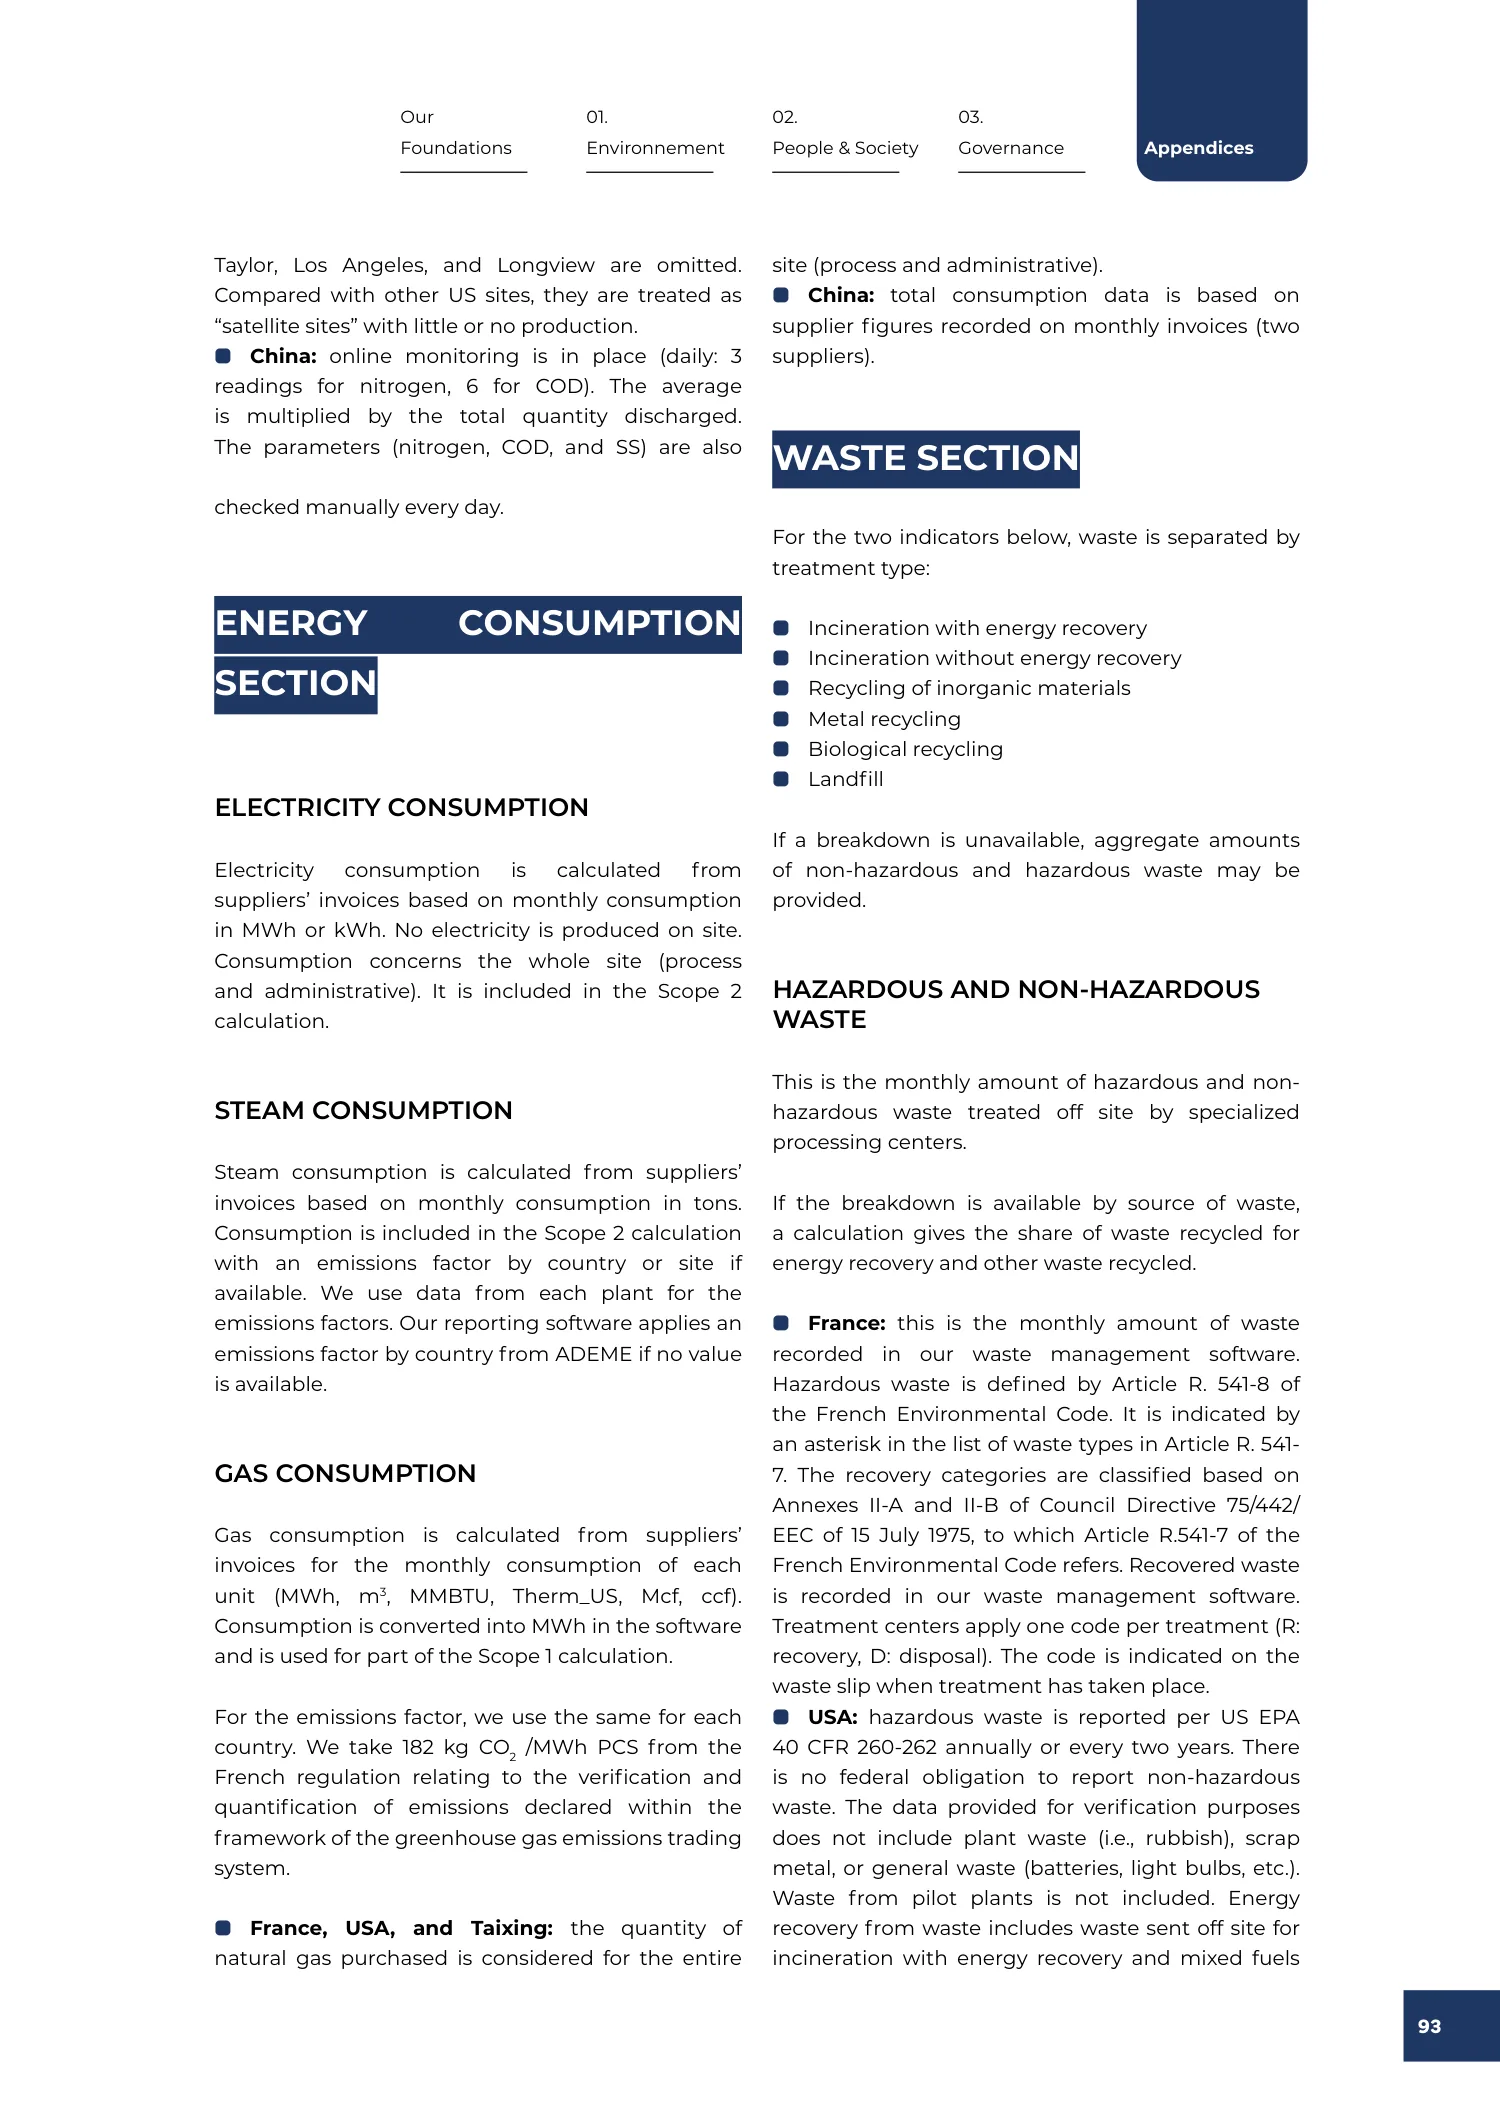
Taylor, Los Angeles, and Longview are omitted. Compared with other US sites, they are treated as “satellite sites” with little or no production.
• China: online monitoring is in place (daily: 3 readings for nitrogen, 6 for COD). The average is multiplied by the total quantity discharged. The parameters (nitrogen, COD, and SS) are also
checked manually every day.
ENERGY CONSUMPTION
SECTION
ELECTRICITY CONSUMPTION
Electricity consumption is calculated from suppliers’ invoices based on monthly consumption in MWh or kWh. No electricity is produced on site. Consumption concerns the whole site (process and administrative). It is included in the Scope 2 calculation.
STEAM CONSUMPTION
Steam consumption is calculated from suppliers’ invoices based on monthly consumption in tons. Consumption is included in the Scope 2 calculation with an emissions factor by country or site if available. We use data from each plant for the emissions factors. Our reporting software applies an emissions factor by country from ADEME if no value is available.
GAS CONSUMPTION
Gas consumption is calculated from suppliers’ invoices for the monthly consumption of each unit (MWh, m3, MMBTU, Therm_US, Mcf, ccf). Consumption is converted into MWh in the software and is used for part of the Scope 1 calculation.
For the emissions factor, we use the same for each country. We take 182 kg CO2 /MWh PCS from the French regulation relating to the verification and quantification of emissions declared within the framework of the greenhouse gas emissions trading system.
• France, USA, and Taixing: the quantity of natural gas purchased is considered for the entire
site (process and administrative).
• China: total consumption data is based on supplier figures recorded on monthly invoices (two suppliers).
WASTE SECTION
For the two indicators below, waste is separated by treatment type:
• Incineration with energy recovery
• Incineration without energy recovery
• Recycling of inorganic materials
• Metal recycling
• Biological recycling
• Landfill
If a breakdown is unavailable, aggregate amounts of non-hazardous and hazardous waste may be provided.
HAZARDOUS AND NON-HAZARDOUS WASTE
This is the monthly amount of hazardous and non-hazardous waste treated off site by specialized processing centers.
If the breakdown is available by source of waste, a calculation gives the share of waste recycled for energy recovery and other waste recycled.
• France: this is the monthly amount of waste recorded in our waste management software. Hazardous waste is defined by Article R. 541-8 of the French Environmental Code. It is indicated by an asterisk in the list of waste types in Article R. 541-7. The recovery categories are classified based on Annexes II-A and II-B of Council Directive 75/442/ EEC of 15 July 1975, to which Article R.541-7 of the French Environmental Code refers. Recovered waste is recorded in our waste management software. Treatment centers apply one code per treatment (R: recovery, D: disposal). The code is indicated on the waste slip when treatment has taken place.
• USA: hazardous waste is reported per US EPA 40 CFR 260-262 annually or every two years. There is no federal obligation to report non-hazardous waste. The data provided for verification purposes does not include plant waste (i.e., rubbish), scrap metal, or general waste (batteries, light bulbs, etc.). Waste from pilot plants is not included. Energy recovery from waste includes waste sent off site for incineration with energy recovery and mixed fuels
Report page 94
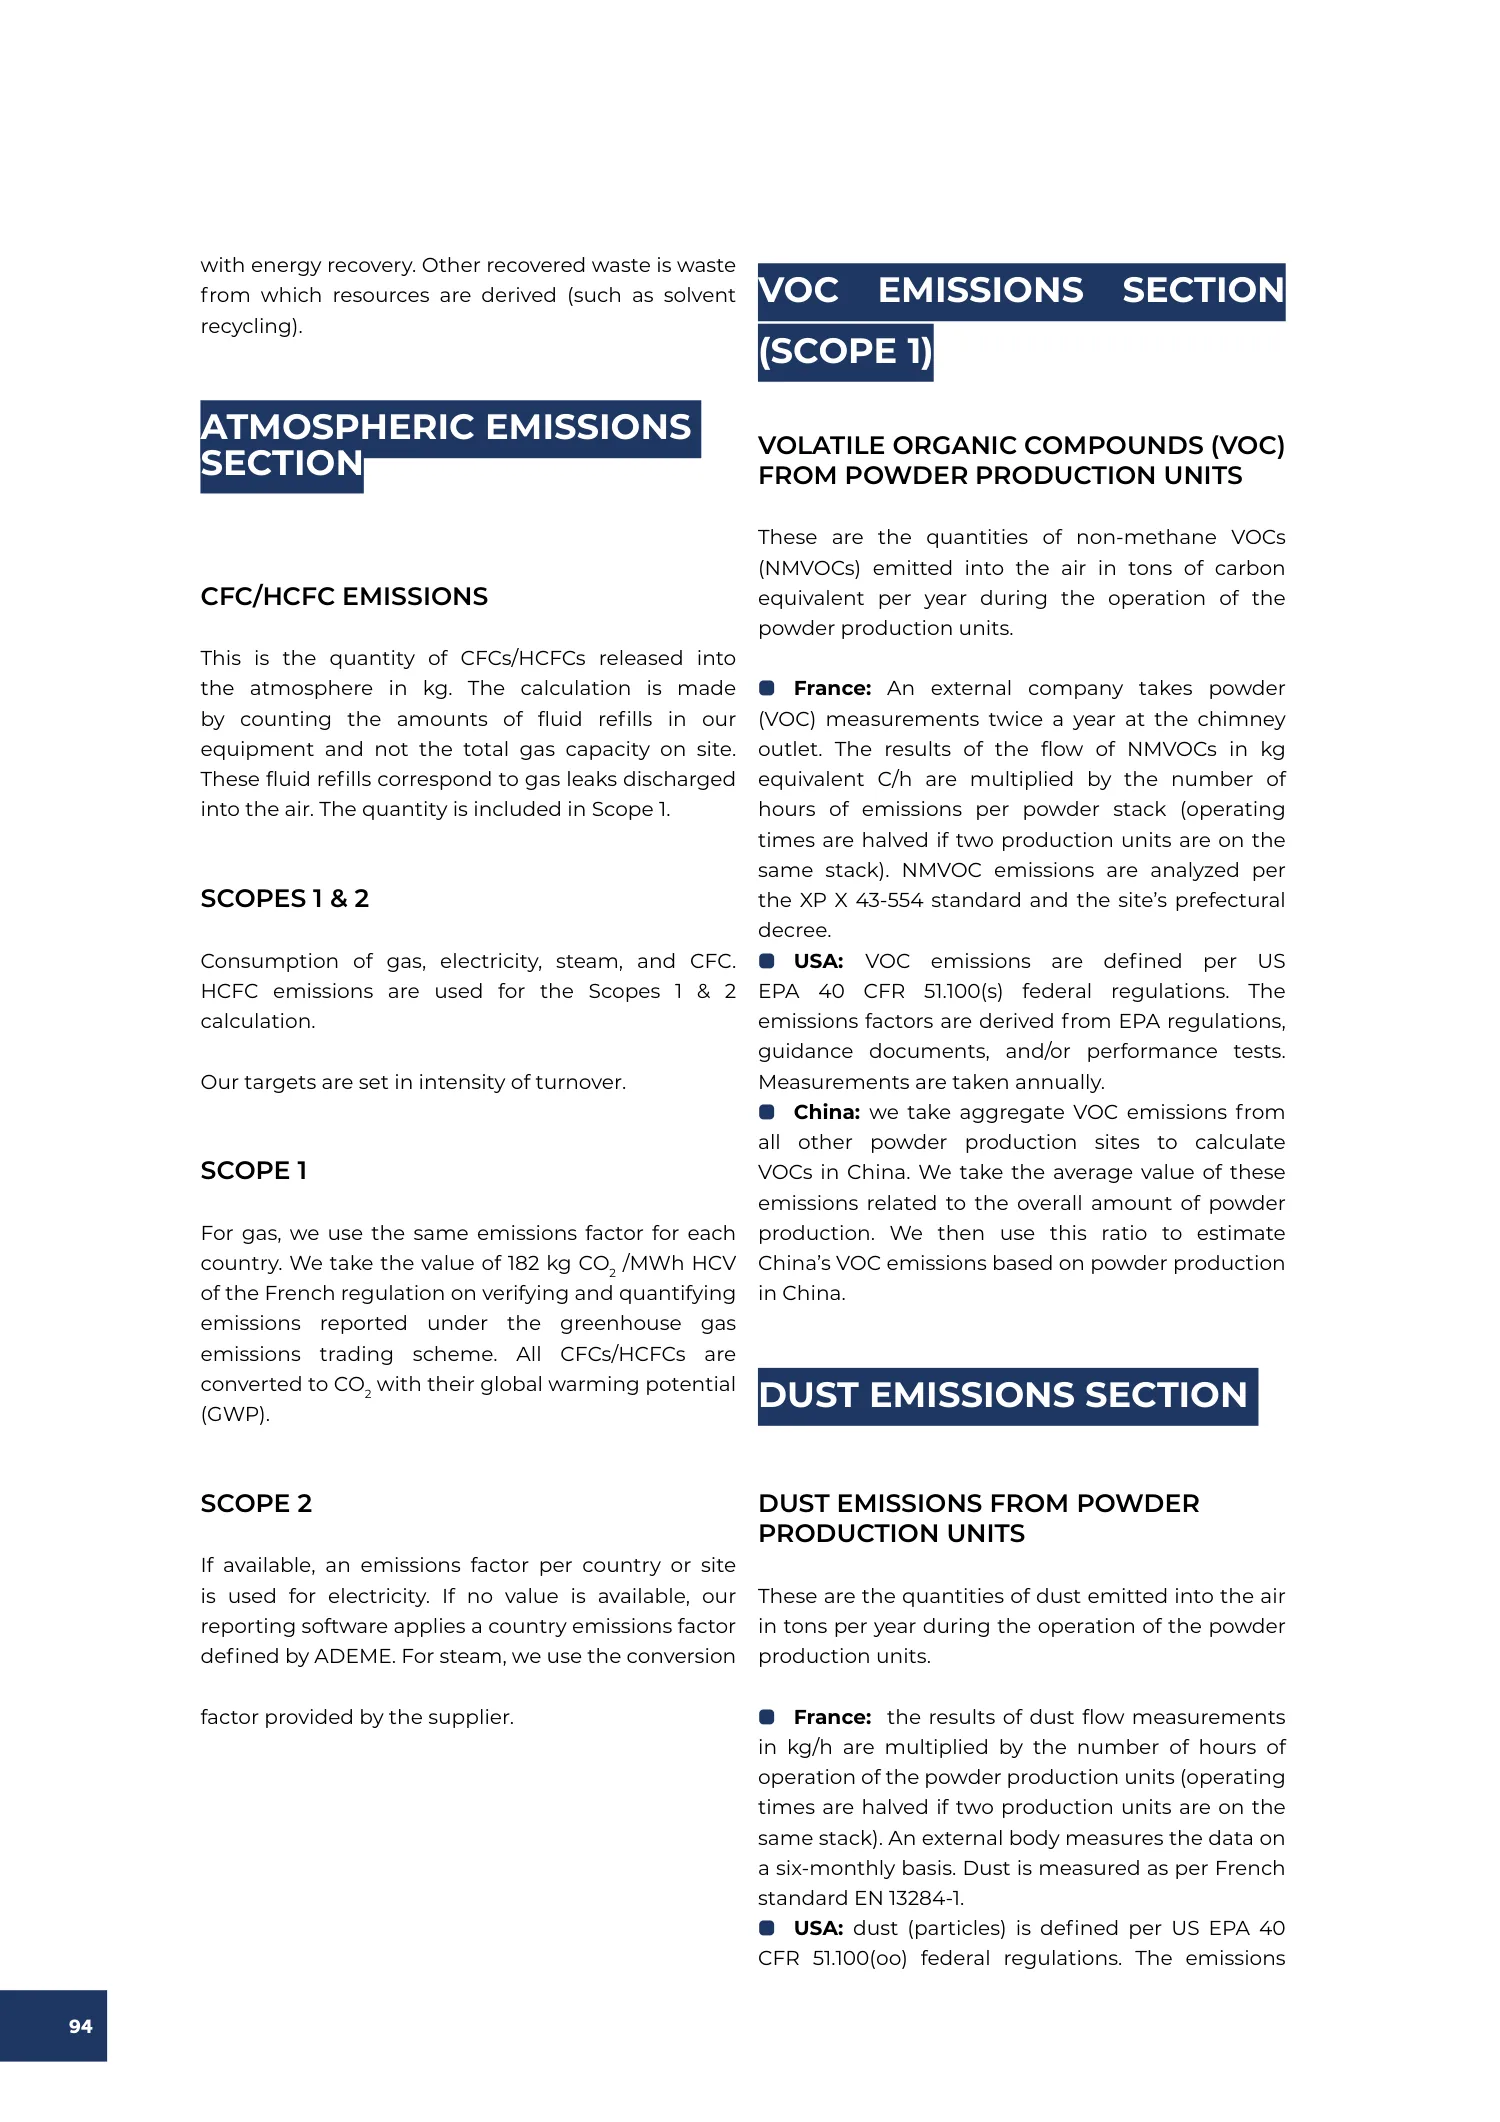
with energy recovery. Other recovered waste is waste from which resources are derived (such as solvent recycling).
ATMOSPHERIC EMISSIONS SECTION
CFC/HCFC EMISSIONS
This is the quantity of CFCs/HCFCs released into the atmosphere in kg. The calculation is made by counting the amounts of fluid refills in our equipment and not the total gas capacity on site. These fluid refills correspond to gas leaks discharged into the air. The quantity is included in Scope 1.
SCOPES 1 & 2
Consumption of gas, electricity, steam, and CFC. HCFC emissions are used for the Scopes 1 & 2 calculation.
Our targets are set in intensity of turnover.
SCOPE 1
For gas, we use the same emissions factor for each country. We take the value of 182 kg CO2 /MWh HCV of the French regulation on verifying and quantifying emissions reported under the greenhouse gas emissions trading scheme. All CFCs/HCFCs are converted to CO2 with their global warming potential (GWP).
SCOPE 2
If available, an emissions factor per country or site is used for electricity. If no value is available, our reporting software applies a country emissions factor defined by ADEME. For steam, we use the conversion
factor provided by the supplier.
VOC EMISSIONS SECTION
(SCOPE 1)
VOLATILE ORGANIC COMPOUNDS (VOC) FROM POWDER PRODUCTION UNITS
These are the quantities of non-methane VOCs (NMVOCs) emitted into the air in tons of carbon equivalent per year during the operation of the powder production units.
• France: An external company takes powder (VOC) measurements twice a year at the chimney outlet. The results of the flow of NMVOCs in kg equivalent C/h are multiplied by the number of hours of emissions per powder stack (operating times are halved if two production units are on the same stack). NMVOC emissions are analyzed per the XP X 43-554 standard and the site’s prefectural decree.
• USA: VOC emissions are defined per US EPA 40 CFR 51.100(s) federal regulations. The emissions factors are derived from EPA regulations, guidance documents, and/or performance tests. Measurements are taken annually.
• China: we take aggregate VOC emissions from all other powder production sites to calculate VOCs in China. We take the average value of these emissions related to the overall amount of powder production. We then use this ratio to estimate China’s VOC emissions based on powder production in China.
DUST EMISSIONS SECTION
DUST EMISSIONS FROM POWDER PRODUCTION UNITS
These are the quantities of dust emitted into the air in tons per year during the operation of the powder production units.
• France: the results of dust flow measurements in kg/h are multiplied by the number of hours of operation of the powder production units (operating times are halved if two production units are on the same stack). An external body measures the data on a six-monthly basis. Dust is measured as per French standard EN 13284-1.
• USA: dust (particles) is defined per US EPA 40 CFR 51.100(oo) federal regulations. The emissions
Report page 95
factors are derived from EPA regulations, guidance documents, and/or performance tests. Measurements are taken annually.
• China: to calculate dust in China, we take aggregate dust emissions from all powder production units. We take the average value of these emissions concerning the overall amount of powder production.
OTHER SCOPE 3 INDICATORS
Our targets are set in absolute values.
The scope of consolidation for all scope 3 indicators correspond to the financial consolidation scope.
• Category 3-1: Purchased goods or services - It includes all of the upstream (cradle-to-gate) emissions from purchased goods and services, including raw materials such as monomers, additives, and reactants, as well as purchase/ resale and packaging. This category is the most contributive to Scope 3.
• Category 3-2: Capital goods - upstream (cradle-to-gate) emissions of purchased capital goods. Emissions from factory equipment acquired during the reporting year: machines, buildings, vehicles.
• Category 3-3: Fuel and Energy-Related Activities not Included in Scope 1 or Scope 2 - extraction, production, and transportation of fuels and energy purchased by SNF not included in scopes 1 & 2. Emissions before combustion (extraction, production, processing, transport, distribution).
• Category 3-4: Upstream Transportation and Distribution - transportation and distribution of purchased products by SNF Group in the reporting year between an SNF production plant and its direct suppliers (manufacturers or resellers/traders). Transportation and distribution of sold products for which SNF bears the transportation costs, from SNF manufacturing plants to direct customers during the reporting year. Burned fuels from transportation sources (all motorized vehicles and by road, air, rail, and sea/river for freight) from raw materials and packaging.
• Category 3-5: Waste Generated in Operations - disposal and treatment of waste generated during SNF’s operations. End of life for waste and discharged water.
• Category 3-6: Business Travel - Employees’ business travel emissions. Burning fuel from transportation sources used specifically for business-related matters.
• Category 3-7: Employee Commuting -emissions from transportation of employees between their home and SNF.
• Category 3-8: Upstream Leased Assets -emissions related to leased assets. This category does not concern SNF. For the chemical industry, leasing is included in Scope 1 or 2.
• Category 3-9: Downstream transportation and distribution - Transportation and distribution of sold products in vehicles not owned or controlled by SNF.
• Category 3-10: Processing of Sold Products - Not calculated because it cannot be reasonably tracked.
• Category 3-11: Use of Sold Products - Direct emissions of SNF products. SNF sets assumptions for estimating emissions in this category for all its products regarding their final use. This mainly involves the use of electricity.
• Category 3-12: End-of-Life Treatment of Sold Products - It is impossible to quantify the fate of our polymers precisely. Thus, end-of-life SNF products are estimated according to the product category and application field.
• Category 3-13: Downstream leased assets - Not relevant to the chemical sector.
• Category 3-14: Franchises - Not relevant to the chemical sector.
• Category 3-15: Investments - No Information available.
Report page 96
SOCIAL INDICATORS
The scope of consolidation for all social indicators corresponds to the financial consolidation scope.
Total Number of employees (Headcount)
This indicator reflects the total number of employees in our subsidiaries as of December 31 of year N-1 and N, including active employees and those with suspended contracts.
The following types of contracts are considered:
• Permanent Contracts: Employees on open-ended contracts.
• Fixed-Term Contracts: Employees on contracts with a specific end date.
• Apprenticeship and Professionalization Contracts: Employees in formal training contracts, including apprentices and those in professionalization programs.
• Non-Guaranteed Hours Contracts: Employees without a set number of working hours, such as zero-hour or on-call contracts.
Exclusions: Temporary agency workers and interns.
Social category (Management / Non-management)
This indicator categorizes employees into "Management" or "Non-Management" groups based on their qualifications, education, and responsibilities.
Management employees
Positions requiring high qualifications or managerial responsibilities.
• In France: Defined by collective bargaining agreements as sectors 2 and 3 (technicians, supervisors, executives).
• In the United States: Includes management and all "white-collar" employees.
• In China: Includes employees with a degree equal to or above Gaozhong (Doctorate, Master’s, Bachelor’s, etc.).
Non-management employees
Employees in operational or technical roles without significant managerial responsibilities.
• In France: Defined as sector 1 (workers and other employees).
• In the United States: Includes all "blue-collar" employees.
• In China: Includes employees with a degree below Gaozhong.
Number of employees (Headcount) by Age
This indicator provides the breakdown of employees as of December 31 of the year N, categorized into the following age groups:
• Under 30
• 30-50
• Over 50
Employees by Contract Type
We classify employees based on their employment contract type:
• Permanent Employees: Employees on open-ended contracts.
• Fixed-Term Employees: Employees on fixed-term contracts with specified end dates.
• Apprenticeship and Professionalization Employees: Employees in apprenticeship or professionalization contracts.
• Non-Guaranteed Hours Employees: Employees without a set number of working hours (e.g., zero-hour or on-call contracts).
Employees by Working Time
We categorize employees based on their working hours:
• Full-Time Employees: Employees working full-time according to our subsidiary standards, regardless of contract type.
• Part-Time Employees: Employees working fewer hours than the subsidiary's full-time standard.
Report page 97
Employees with Disabilities
This indicator reflects the proportion of employees who self-identify as having disabilities, categorized as:
• Management Employees
• Non-Management Employees
This indicator is defined in accordance with local laws and standards.
Employees Who Have Left the Organization During the Year
This indicator counts the total number of employees who left our organization during the reporting year, categorized as:
• Management Employees.
• Non-management Employees.
• Inclusions: Resignation, retirement, end of fixed-term contracts, dismissal.
Percentage of Employee Turnover
This indicator represents the proportion of employees who have left the organization over the course of the year (year N) relative to the total number of employees at the beginning of the year (year N-1). It reflects voluntary and involuntary departures across our subsidiaries.
Non-Employee Workforce
Self-Employed Individuals with Contracts to Supply Labor
This indicator includes all self-employed individuals engaged under formal agreements to supply labor or services (e.g., freelancers, independent contractors, consultants).
Tempory workers Provided by Employment Agencies (NACE N78)
This indicator measures the total number of individuals supplied by employment agencies who work under our operational control.
Adequate wage
This indicator serves to verify that all employees of the group, regardless of the geographic location of the subsidiary, earn a decent wage. SNF defines a decent wage as one that enables an employee to live decently in the region where the SNF subsidiary is located. This decent wage must allow a person (and their family in some cases) to meet their essential needs (water, food, housing, healthcare, education, energy, etc.), taking into account the country’s situation and calculated for work performed during regular working hours. This definition is based on the principles of the ILO (International Labour Organization) and adheres to the principles of the Global Compact and the United Nations.
A collection of minimum salary data was conducted from each subsidiary. The minimum salary is defined as pay to a full-time employee who was with the company for more than 6 months in 2025, regardless of the position, qualification level, seniority in the company, gender, or age, considering only our workforce.
The HR department of each subsidiary was then asked to carry out a cost-of-living study in the region where the site is located. This study made it possible to define a decent salary in each of the regions where SNF operates. The criteria used in this study are as follows:
• Economic situation of the country (inflation, unemployment rate, etc.)
• Local employment market for similar jobs in the same industry
• Social coverage provided or not provided by the state
• Fertility rate
• Average cost of living for an individual or a family (adequate housing, food, access to energy and clean water, transportation costs, access to education, etc.)
• Number of salaries per family (considering that in some countries, women’s employability is low, etc.)
Internal auditors at SNF SA check that, for each subsidiary, the minimum salary is higher than the decent salary.
Report page 98
TRAINING AND SKILLS DEVELOPMENT
Total Number of Hours of Training
The total number of training hours includes all hours spent on vocational training by employees across all contract types (permanent, non-permanent, full-time, part-time, temporary workers...) during the reporting year. This covers both external training (off site) and internal training (on-the-job or at the workstation).
• Exclusions (in France): Training linked to academic learning (e.g., apprenticeships, degree programs) and training related to individual training accounts (e.g., CPF in France).
• For France, there is a gap between the completion and recording of the training. Also, we estimate that 20% of the training hours are not registered for the year of the ESG report; consequently 20% are added.
• For USA, training checklists include all hours worked on-the- job until the training check list is completed. A percentage is assigned to these hours to reflect actual time trained on the job.
Training Hours on Health and Safety
This tracks the portion of training hours dedicated to health and safety topics. This indicator takes ESG e-learning into account.
SOCIAL PROTECTION
Percentage of employees
This indicator tracks the percentage of employees who are covered by state social protection or guaranteed by the company.
Social protection refers to all measures that provide access to healthcare and income support in the event of difficult life situations, such as job loss, illness and the need for medical care, childbirth and child-rearing, or retirement and the need for a pension. It encompasses a set of measures aimed at reducing and preventing poverty and vulnerability throughout the life cycle.
This year, the data is presented by geographic area, and the scope covers all subsidiaries consolidated within the Group as of 2025.
HEALTH AND SAFETY
INDICATORS
The Health & Safety reporting perimeter now covers all SNF Group subsidiaries.
Number of fatalities
This is the number of fatalities due to industrial accidents.
Number of worked hours
These are the actual working hours over the year for all staff including training hours (excluding temporary staff).
For staff outside the management package, overtime is included.
7 hours per day for people on a day package are counted.
Hours spent on business travel and assignments are recorded as hours worked.
Lost days and days of paid leave are excluded from the calculation of hours worked.
Number of lost time injuries
Accident with workstop
Number of lost days
The number of days lost corresponds to the total number of working days, normally scheduled, not worked by a person concerned by a work stoppage due to a work-related accident, regardless of the day of the accident.
Number of recordable injuries
Accident with and without work stoppage
Report page 99
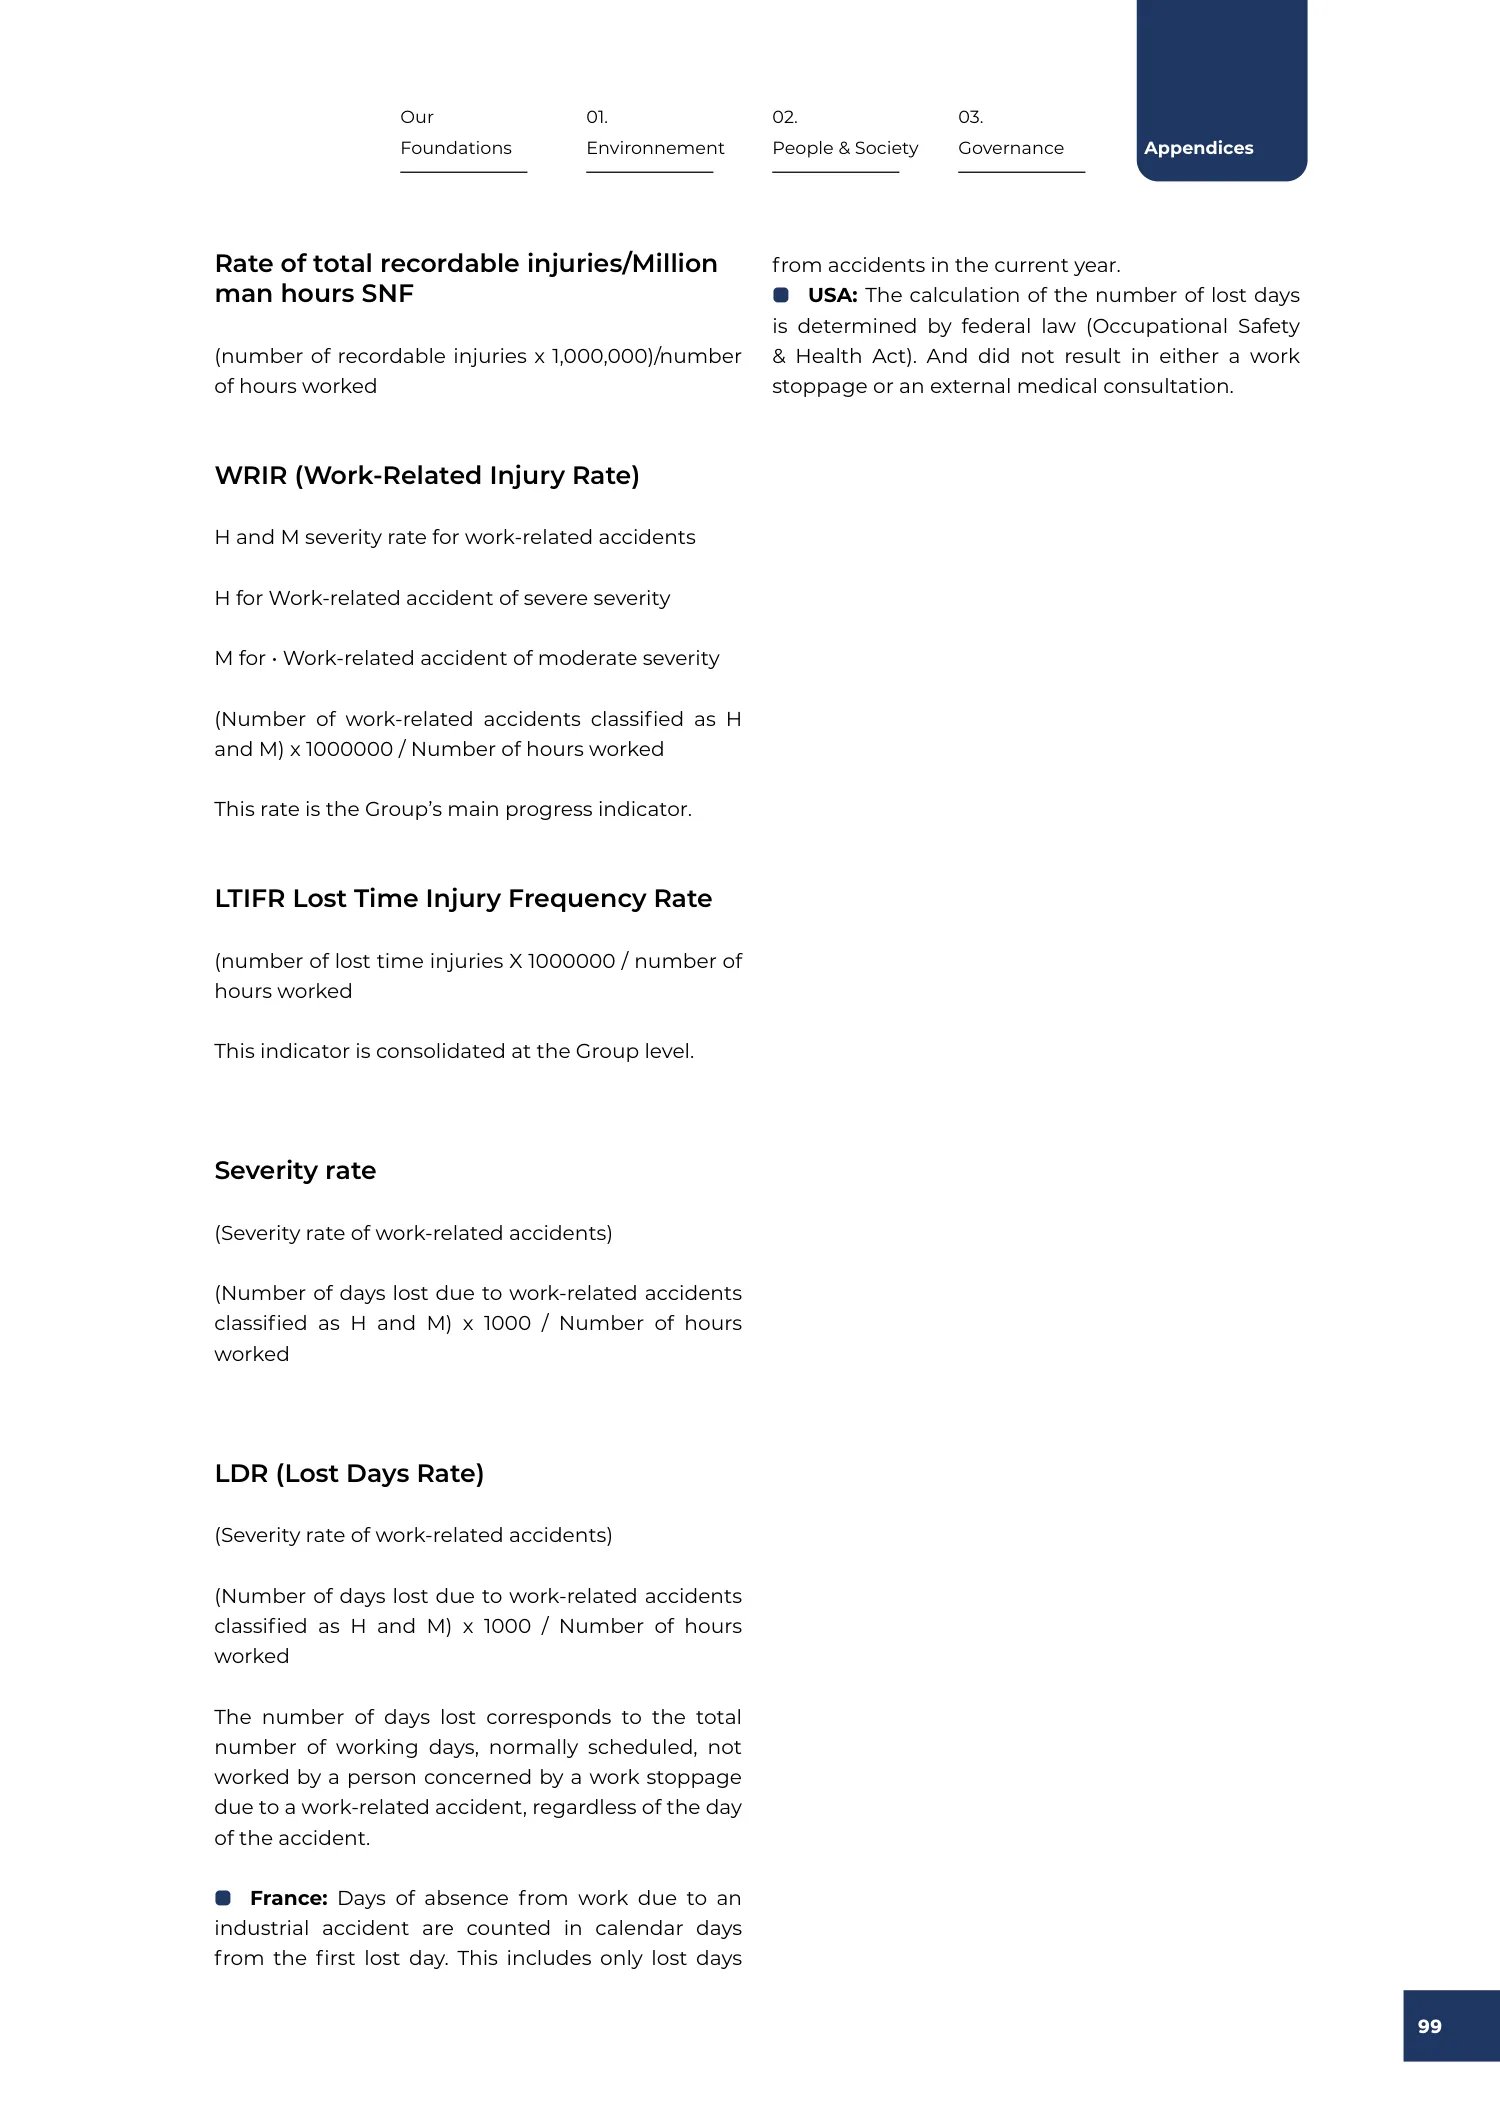
Rate of total recordable injuries/Million man hours SNF
(number of recordable injuries x 1,000,000)/number of hours worked
WRIR (Work-Related Injury Rate)
H and M severity rate for work-related accidents
H for Work-related accident of severe severity
M for
• Work-related accident of moderate severity
(Number of work-related accidents classified as H and M) x 1000000 / Number of hours worked
This rate is the Group’s main progress indicator.
LTIFR Lost Time Injury Frequency Rate
(number of lost time injuries X 1000000 / number of hours worked
This indicator is consolidated at the Group level.
Severity rate
(Severity rate of work-related accidents)
(Number of days lost due to work-related accidents classified as H and M) x 1000 / Number of hours worked
LDR (Lost Days Rate)
(Severity rate of work-related accidents)
(Number of days lost due to work-related accidents classified as H and M) x 1000 / Number of hours worked
The number of days lost corresponds to the total number of working days, normally scheduled, not worked by a person concerned by a work stoppage due to a work-related accident, regardless of the day of the accident.
• France: Days of absence from work due to an industrial accident are counted in calendar days from the first lost day. This includes only lost days
from accidents in the current year.
• USA: The calculation of the number of lost days is determined by federal law (Occupational Safety & Health Act). And did not result in either a work stoppage or an external medical consultation.
4 pagesGRI Content Index
The GRI Content Index maps the report's disclosures to applicable GRI Standards, UN Global Compact principles, and UN Sustainable Development Goals. It directs readers to the relevant report pages for organizational, environmental, social, and governance information.
Accessible text version of this section
Report page 100
GRI Content Index
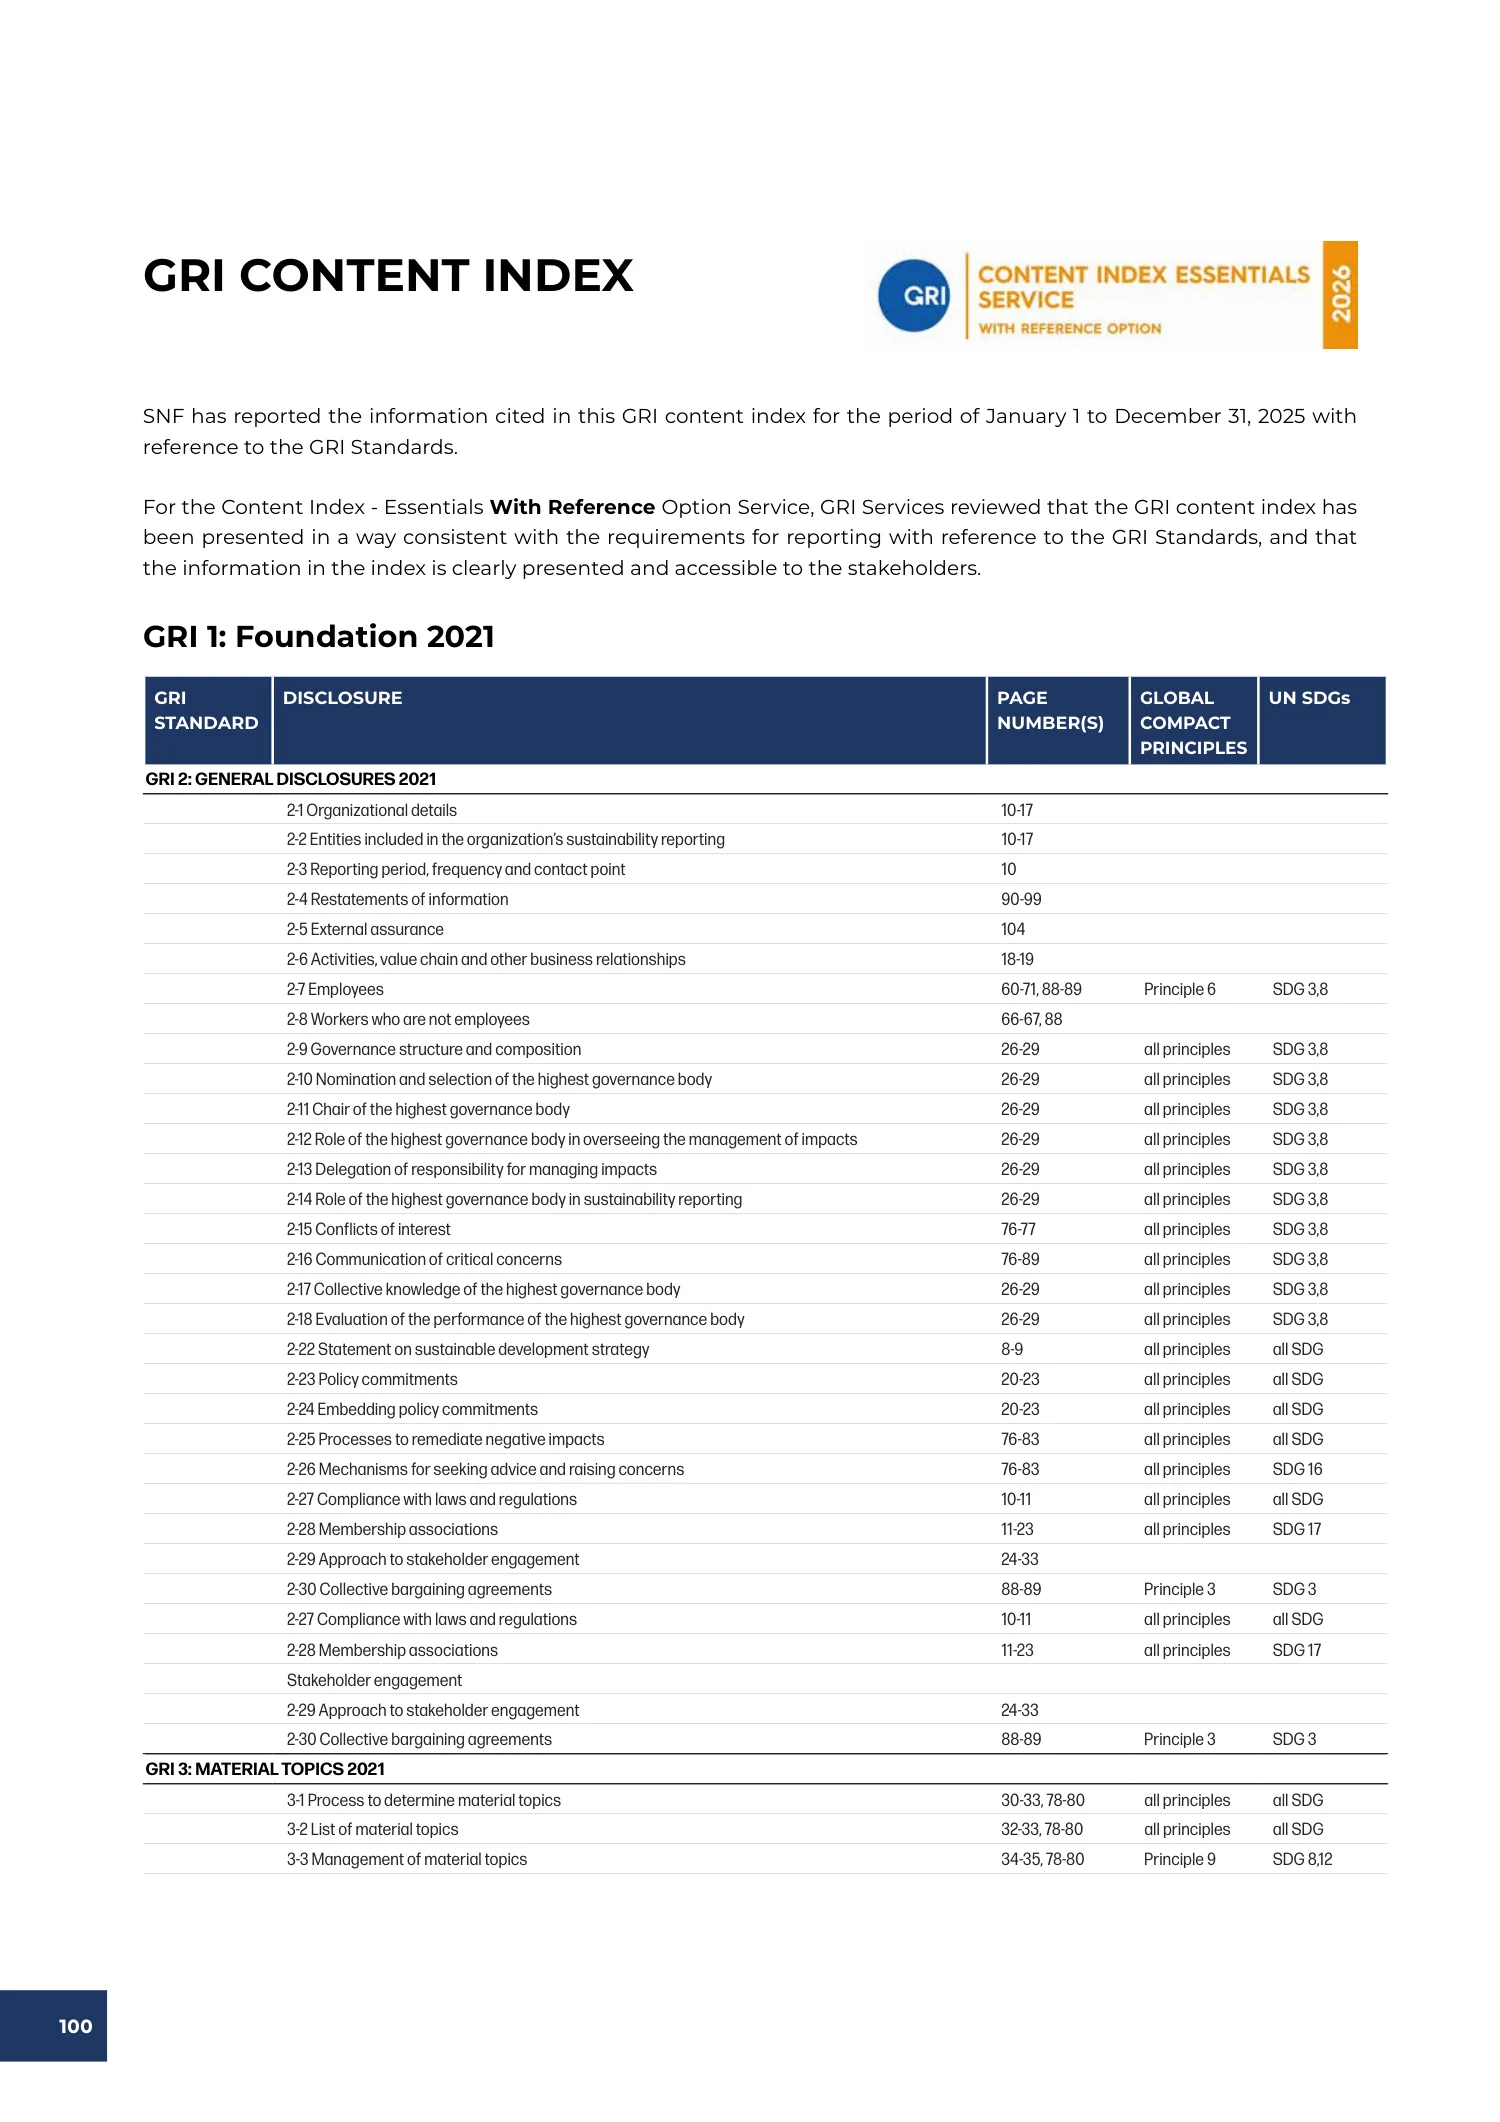
SNF has reported the information cited in this GRI Content Index for the period January 1 to December 31, 2025, with reference to the GRI Standards.
For the Content Index – Essentials With Reference Option Service, GRI Services reviewed that the index is presented consistently with the requirements for reporting with reference to the GRI Standards and that its information is clearly presented and accessible to stakeholders.
GRI 1: Foundation 2021
| GRI standard | Disclosure | Page number(s) | Global Compact principles | UN SDGs |
|---|---|---|---|---|
| GRI 2: GENERAL DISCLOSURES 2021 | ||||
| 2-1 Organizational details | 10-17 | Not reported | Not reported | |
| 2-2 Entities included in the organization’s sustainability reporting | 10-17 | Not reported | Not reported | |
| 2-3 Reporting period, frequency and contact point | 10 | Not reported | Not reported | |
| 2-4 Restatements of information | 90-99 | Not reported | Not reported | |
| 2-5 External assurance | 104 | Not reported | Not reported | |
| 2-6 Activities, value chain and other business relationships | 18-19 | Not reported | Not reported | |
| 2-7 Employees | 60-71, 88-89 | Principle 6 | SDG 3,8 | |
| 2-8 Workers who are not employees | 66-67, 88 | Not reported | Not reported | |
| 2-9 Governance structure and composition | 26-29 | all principles | SDG 3,8 | |
| 2-10 Nomination and selection of the highest governance body | 26-29 | all principles | SDG 3,8 | |
| 2-11 Chair of the highest governance body | 26-29 | all principles | SDG 3,8 | |
| 2-12 Role of the highest governance body in overseeing the management of impacts | 26-29 | all principles | SDG 3,8 | |
| 2-13 Delegation of responsibility for managing impacts | 26-29 | all principles | SDG 3,8 | |
| 2-14 Role of the highest governance body in sustainability reporting | 26-29 | all principles | SDG 3,8 | |
| 2-15 Conflicts of interest | 76-77 | all principles | SDG 3,8 | |
| 2-16 Communication of critical concerns | 76-89 | all principles | SDG 3,8 | |
| 2-17 Collective knowledge of the highest governance body | 26-29 | all principles | SDG 3,8 | |
| 2-18 Evaluation of the performance of the highest governance body | 26-29 | all principles | SDG 3,8 | |
| 2-22 Statement on sustainable development strategy | 8-9 | all principles | all SDG | |
| 2-23 Policy commitments | 20-23 | all principles | all SDG | |
| 2-24 Embedding policy commitments | 20-23 | all principles | all SDG | |
| 2-25 Processes to remediate negative impacts | 76-83 | all principles | all SDG | |
| 2-26 Mechanisms for seeking advice and raising concerns | 76-83 | all principles | SDG 16 | |
| 2-27 Compliance with laws and regulations | 10-11 | all principles | all SDG | |
| 2-28 Membership associations | 11-23 | all principles | SDG 17 | |
| 2-29 Approach to stakeholder engagement | 24-33 | Not reported | Not reported | |
| 2-30 Collective bargaining agreements | 88-89 | Principle 3 | SDG 3 | |
| 2-27 Compliance with laws and regulations | 10-11 | all principles | all SDG | |
| 2-28 Membership associations | 11-23 | all principles | SDG 17 | |
| Stakeholder engagement | ||||
| 2-29 Approach to stakeholder engagement | 24-33 | Not reported | Not reported | |
| 2-30 Collective bargaining agreements | 88-89 | Principle 3 | SDG 3 | |
| GRI 3: MATERIAL TOPICS 2021 | ||||
| 3-1 Process to determine material topics | 30-33, 78-80 | all principles | all SDG | |
| 3-2 List of material topics | 32-33, 78-80 | all principles | all SDG | |
| 3-3 Management of material topics | 34-35, 78-80 | Principle 9 | SDG 8,12 | |
Report page 101
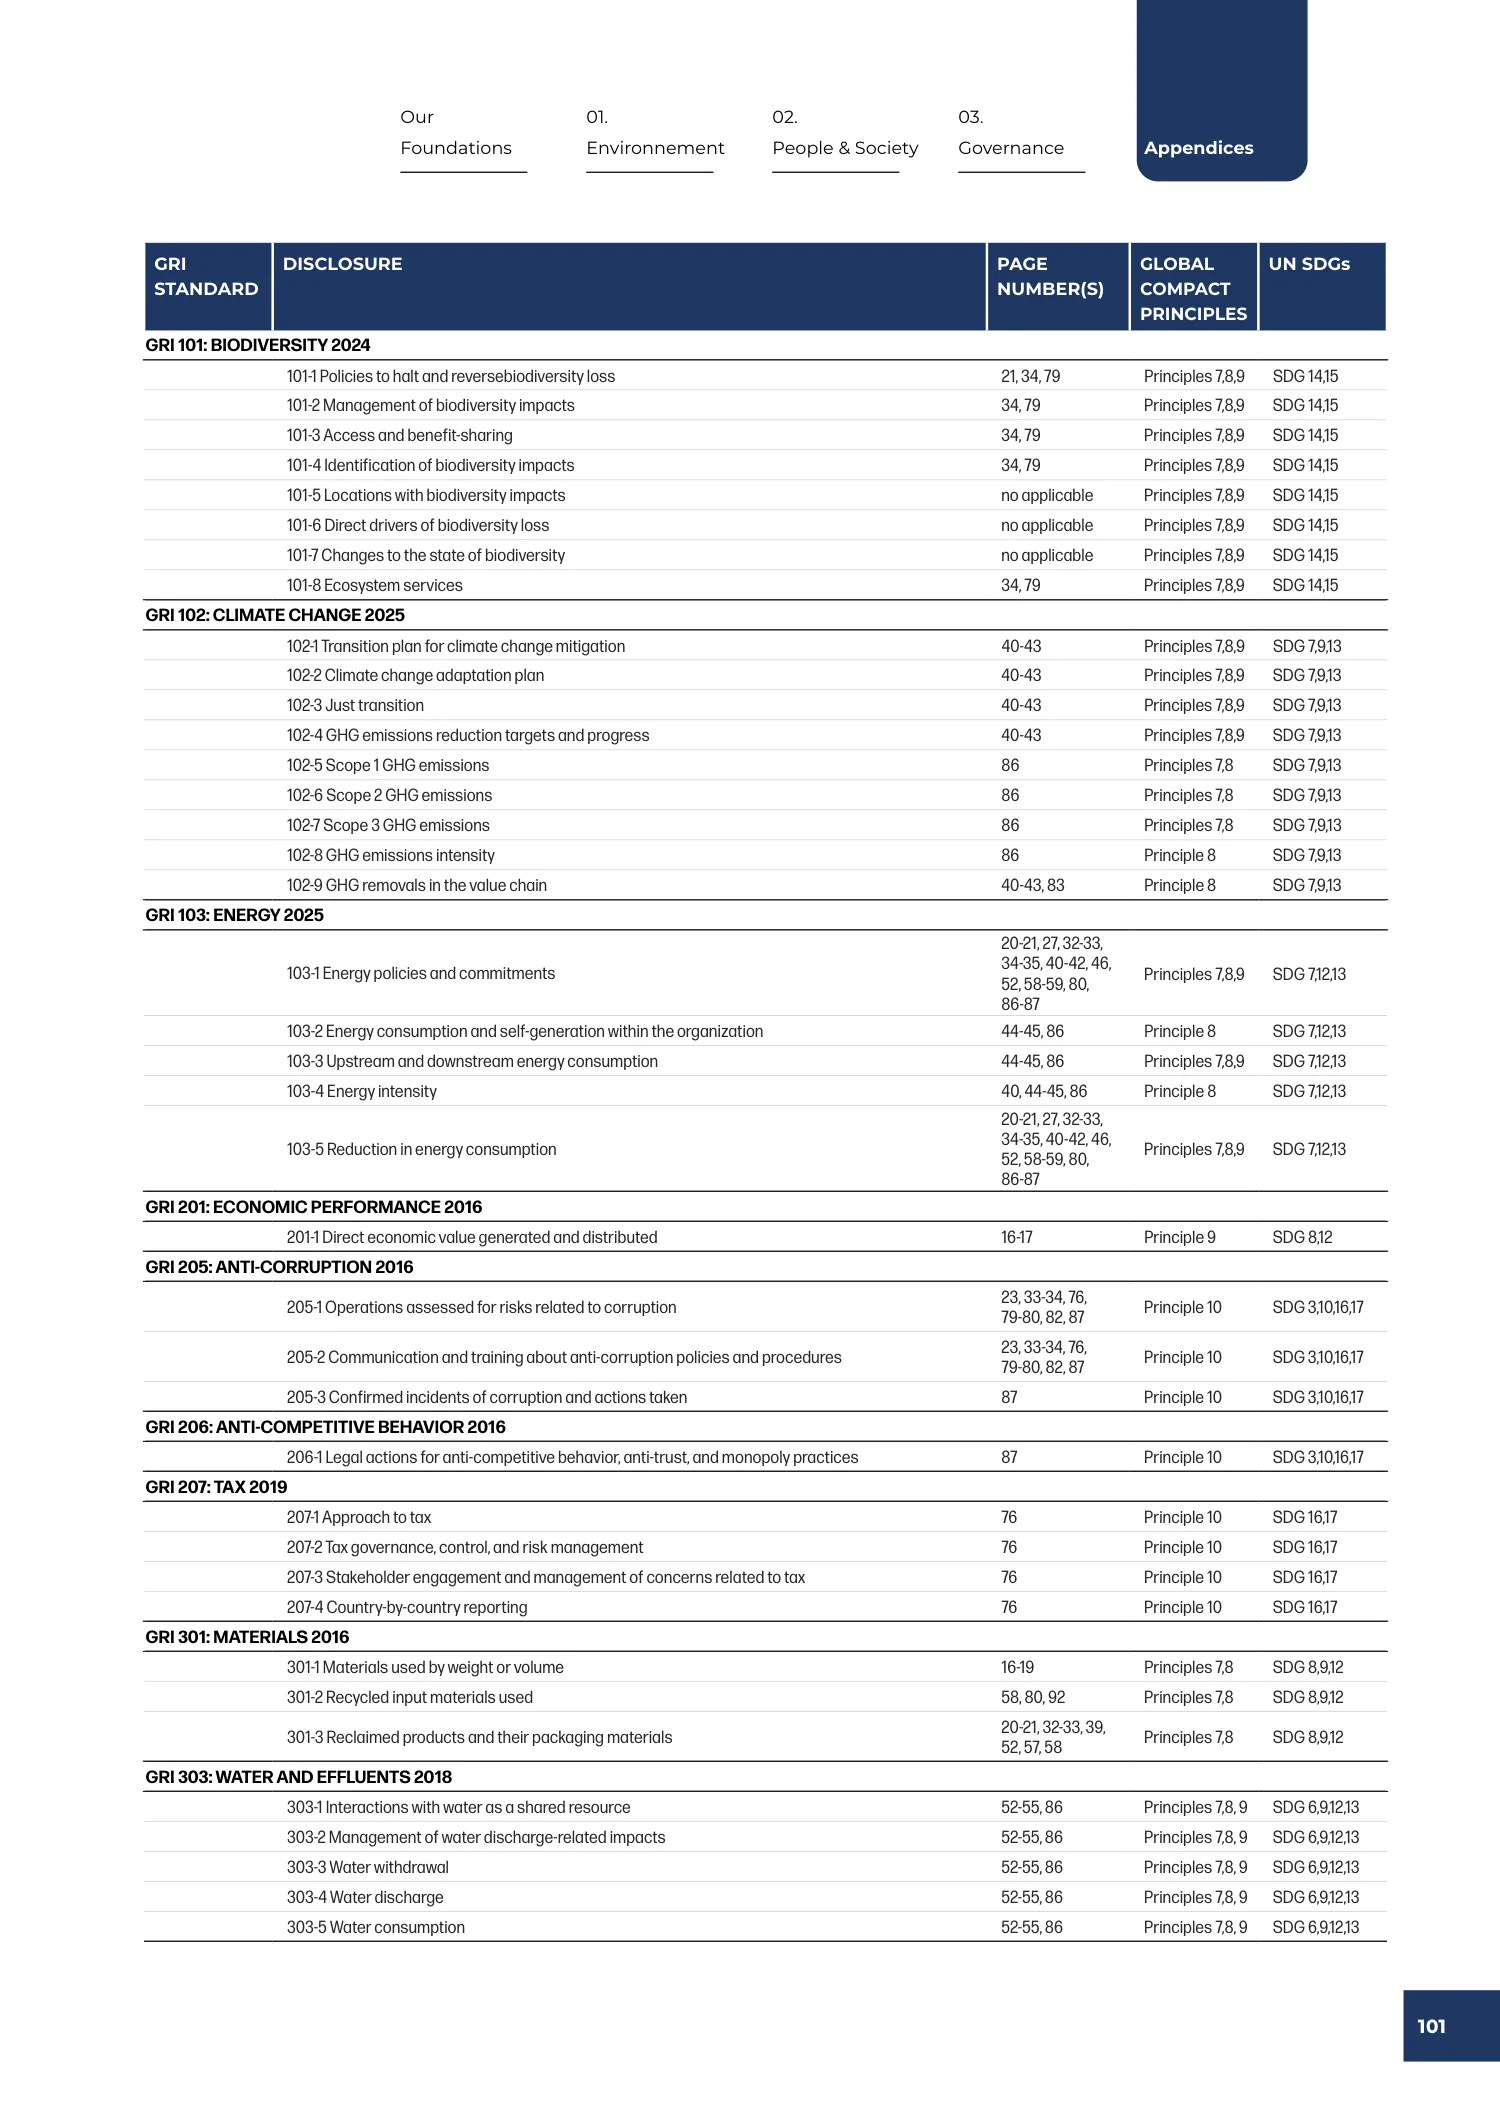
| GRI standard | Disclosure | Page number(s) | Global Compact principles | UN SDGs |
|---|---|---|---|---|
| GRI 101: BIODIVERSITY 2024 | ||||
| 101-1 Policies to halt and reverse biodiversity loss | 21, 34, 79 | Principles 7,8,9 | SDG 14,15 | |
| 101-2 Management of biodiversity impacts | 34, 79 | Principles 7,8,9 | SDG 14,15 | |
| 101-3 Access and benefit-sharing | 34, 79 | Principles 7,8,9 | SDG 14,15 | |
| 101-4 Identification of biodiversity impacts | 34, 79 | Principles 7,8,9 | SDG 14,15 | |
| 101-5 Locations with biodiversity impacts | no applicable | Principles 7,8,9 | SDG 14,15 | |
| 101-6 Direct drivers of biodiversity loss | no applicable | Principles 7,8,9 | SDG 14,15 | |
| 101-7 Changes to the state of biodiversity | no applicable | Principles 7,8,9 | SDG 14,15 | |
| 101-8 Ecosystem services | 34, 79 | Principles 7,8,9 | SDG 14,15 | |
| GRI 102: CLIMATE CHANGE 2025 | ||||
| 102-1 Transition plan for climate change mitigation | 40-43 | Principles 7,8,9 | SDG 7,9,13 | |
| 102-2 Climate change adaptation plan | 40-43 | Principles 7,8,9 | SDG 7,9,13 | |
| 102-3 Just transition | 40-43 | Principles 7,8,9 | SDG 7,9,13 | |
| 102-4 GHG emissions reduction targets and progress | 40-43 | Principles 7,8,9 | SDG 7,9,13 | |
| 102-5 Scope 1 GHG emissions | 86 | Principles 7,8 | SDG 7,9,13 | |
| 102-6 Scope 2 GHG emissions | 86 | Principles 7,8 | SDG 7,9,13 | |
| 102-7 Scope 3 GHG emissions | 86 | Principles 7,8 | SDG 7,9,13 | |
| 102-8 GHG emissions intensity | 86 | Principle 8 | SDG 7,9,13 | |
| 102-9 GHG removals in the value chain | 40-43, 83 | Principle 8 | SDG 7,9,13 | |
| GRI 103: ENERGY 2025 | ||||
| 103-1 Energy policies and commitments | 20-21, 27, 32-33, 34-35, 40-42, 46, 52, 58-59, 80, | Principles 7,8,9 | SDG 7,12,13 | |
| 103-2 Energy consumption and self-generation within the organization | 86-87 44-45, 86 | Principle 8 | SDG 7,12,13 | |
| 103-3 Upstream and downstream energy consumption | 44-45, 86 | Principles 7,8,9 | SDG 7,12,13 | |
| 103-4 Energy intensity | 40, 44-45, 86 | Principle 8 | SDG 7,12,13 | |
| 103-5 Reduction in energy consumption | 20-21, 27, 32-33, 34-35, 40-42, 46, 52, 58-59, 80, | Principles 7,8,9 | SDG 7,12,13 | |
| GRI 201: ECONOMIC PERFORMANCE 2016 | ||||
| 201-1 Direct economic value generated and distributed | 16-17 | Principle 9 | SDG 8,12 | |
| GRI 205: ANTI-CORRUPTION 2016 | ||||
| 205-1 Operations assessed for risks related to corruption | 23, 33-34, 76, 79-80, 82, 87 | Principle 10 | SDG 3,10,16,17 | |
| 205-2 Communication and training about anti-corruption policies and procedures | 23, 33-34, 76, 79-80, 82, 87 | Principle 10 | SDG 3,10,16,17 | |
| 205-3 Confirmed incidents of corruption and actions taken | 87 | Principle 10 | SDG 3,10,16,17 | |
| GRI 206: ANTI-COMPETITIVE BEHAVIOR 2016 | ||||
| 206-1 Legal actions for anti-competitive behavior, anti-trust, and monopoly practices | 87 | Principle 10 | SDG 3,10,16,17 | |
| GRI 207: TAX 2019 | ||||
| 207-1 Approach to tax | 76 | Principle 10 | SDG 16,17 | |
| 207-2 Tax governance, control, and risk management | 76 | Principle 10 | SDG 16,17 | |
| 207-3 Stakeholder engagement and management of concerns related to tax | 76 | Principle 10 | SDG 16,17 | |
| 207-4 Country-by-country reporting | 76 | Principle 10 | SDG 16,17 | |
| GRI 301: MATERIALS 2016 | ||||
| 301-1 Materials used by weight or volume | 16-19 | Principles 7,8 | SDG 8,9,12 | |
| 301-2 Recycled input materials used | 58, 80, 92 | Principles 7,8 | SDG 8,9,12 | |
| 301-3 Reclaimed products and their packaging materials | 20-21, 32-33, 39, 52, 57, 58 | Principles 7,8 | SDG 8,9,12 | |
| GRI 303: WATER AND EFFLUENTS 2018 | ||||
| 303-1 Interactions with water as a shared resource | 52-55, 86 | Principles 7,8, 9 | SDG 6,9,12,13 | |
| 303-2 Management of water discharge-related impacts | 52-55, 86 | Principles 7,8, 9 | SDG 6,9,12,13 | |
| 303-3 Water withdrawal | 52-55, 86 | Principles 7,8, 9 | SDG 6,9,12,13 | |
| 303-4 Water discharge | 52-55, 86 | Principles 7,8, 9 | SDG 6,9,12,13 | |
| 303-5 Water consumption | 52-55, 86 | Principles 7,8, 9 | SDG 6,9,12,13 | |
Report page 102
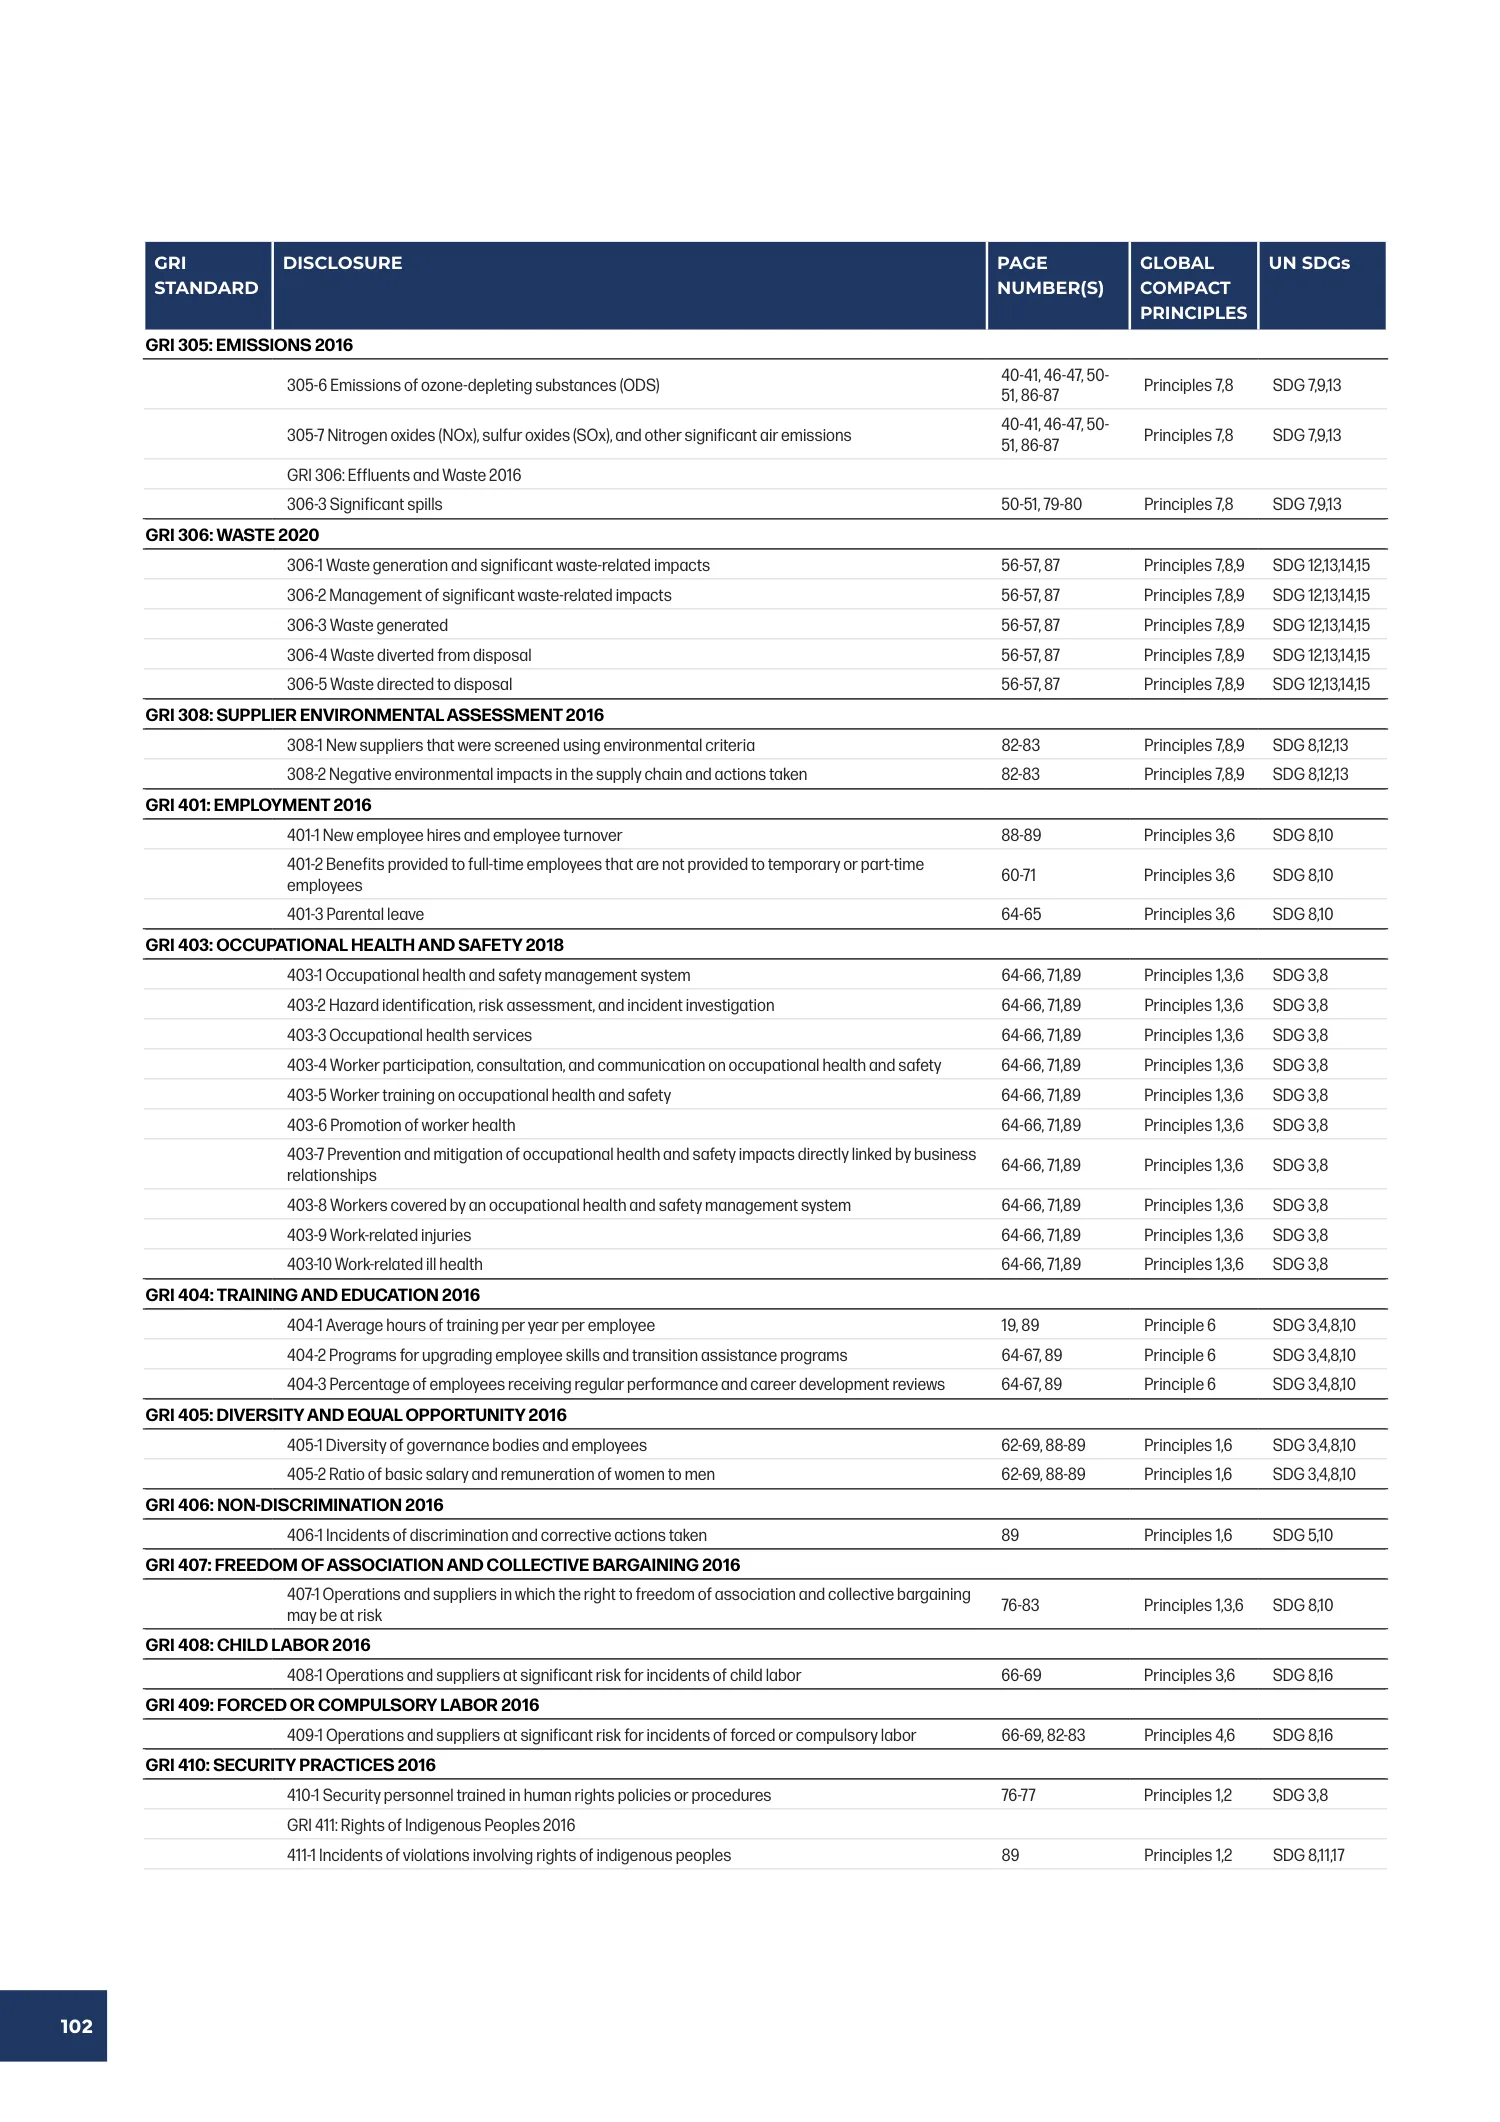
| GRI standard | Disclosure | Page number(s) | Global Compact principles | UN SDGs |
|---|---|---|---|---|
| GRI 305: EMISSIONS 2016 | ||||
| 305-6 Emissions of ozone-depleting substances (ODS) | 40-41, 46-47, 50-51, 86-87 | Principles 7,8 | SDG 7,9,13 | |
| 305-7 Nitrogen oxides (NOx), sulfur oxides (SOx), and other significant air emissions | 40-41, 46-47, 50-51, 86-87 | Principles 7,8 | SDG 7,9,13 | |
| GRI 306: Effluents and Waste 2016 | ||||
| 306-3 Significant spills | 50-51, 79-80 | Principles 7,8 | SDG 7,9,13 | |
| GRI 306: WASTE 2020 | ||||
| 306-1 Waste generation and significant waste-related impacts | 56-57, 87 | Principles 7,8,9 | SDG 12,13,14,15 | |
| 306-2 Management of significant waste-related impacts | 56-57, 87 | Principles 7,8,9 | SDG 12,13,14,15 | |
| 306-3 Waste generated | 56-57, 87 | Principles 7,8,9 | SDG 12,13,14,15 | |
| 306-4 Waste diverted from disposal | 56-57, 87 | Principles 7,8,9 | SDG 12,13,14,15 | |
| 306-5 Waste directed to disposal | 56-57, 87 | Principles 7,8,9 | SDG 12,13,14,15 | |
| GRI 308: SUPPLIER ENVIRONMENTAL ASSESSMENT 2016 | ||||
| 308-1 New suppliers that were screened using environmental criteria | 82-83 | Principles 7,8,9 | SDG 8,12,13 | |
| 308-2 Negative environmental impacts in the supply chain and actions taken | 82-83 | Principles 7,8,9 | SDG 8,12,13 | |
| GRI 401: EMPLOYMENT 2016 | ||||
| 401-1 New employee hires and employee turnover | 88-89 | Principles 3,6 | SDG 8,10 | |
| 401-2 Benefits provided to full-time employees that are not provided to temporary or part-time employees | 60-71 | Principles 3,6 | SDG 8,10 | |
| 401-3 Parental leave | 64-65 | Principles 3,6 | SDG 8,10 | |
| GRI 403: OCCUPATIONAL HEALTH AND SAFETY 2018 | ||||
| 403-1 Occupational health and safety management system | 64-66, 71,89 | Principles 1,3,6 | SDG 3,8 | |
| 403-2 Hazard identification, risk assessment, and incident investigation | 64-66, 71,89 | Principles 1,3,6 | SDG 3,8 | |
| 403-3 Occupational health services | 64-66, 71,89 | Principles 1,3,6 | SDG 3,8 | |
| 403-4 Worker participation, consultation, and communication on occupational health and safety | 64-66, 71,89 | Principles 1,3,6 | SDG 3,8 | |
| 403-5 Worker training on occupational health and safety | 64-66, 71,89 | Principles 1,3,6 | SDG 3,8 | |
| 403-6 Promotion of worker health | 64-66, 71,89 | Principles 1,3,6 | SDG 3,8 | |
| 403-7 Prevention and mitigation of occupational health and safety impacts directly linked by business relationships | 64-66, 71,89 | Principles 1,3,6 | SDG 3,8 | |
| 403-8 Workers covered by an occupational health and safety management system | 64-66, 71,89 | Principles 1,3,6 | SDG 3,8 | |
| 403-9 Work-related injuries | 64-66, 71,89 | Principles 1,3,6 | SDG 3,8 | |
| 403-10 Work-related ill health | 64-66, 71,89 | Principles 1,3,6 | SDG 3,8 | |
| GRI 404: TRAINING AND EDUCATION 2016 | ||||
| 404-1 Average hours of training per year per employee | 19, 89 | Principle 6 | SDG 3,4,8,10 | |
| 404-2 Programs for upgrading employee skills and transition assistance programs | 64-67, 89 | Principle 6 | SDG 3,4,8,10 | |
| 404-3 Percentage of employees receiving regular performance and career development reviews | 64-67, 89 | Principle 6 | SDG 3,4,8,10 | |
| GRI 405: DIVERSITY AND EQUAL OPPORTUNITY 2016 | ||||
| 405-1 Diversity of governance bodies and employees | 62-69, 88-89 | Principles 1,6 | SDG 3,4,8,10 | |
| 405-2 Ratio of basic salary and remuneration of women to men | 62-69, 88-89 | Principles 1,6 | SDG 3,4,8,10 | |
| GRI 406: NON-DISCRIMINATION 2016 | ||||
| 406-1 Incidents of discrimination and corrective actions taken | 89 | Principles 1,6 | SDG 5,10 | |
| GRI 407: FREEDOM OF ASSOCIATION AND COLLECTIVE BARGAINING 2016 | ||||
| 407-1 Operations and suppliers in which the right to freedom of association and collective bargaining may be at risk | 76-83 | Principles 1,3,6 | SDG 8,10 | |
| GRI 408: CHILD LABOR 2016 | ||||
| 408-1 Operations and suppliers at significant risk for incidents of child labor | 66-69 | Principles 3,6 | SDG 8,16 | |
| GRI 409: FORCED OR COMPULSORY LABOR 2016 | ||||
| 409-1 Operations and suppliers at significant risk for incidents of forced or compulsory labor | 66-69, 82-83 | Principles 4,6 | SDG 8,16 | |
| GRI 410: SECURITY PRACTICES 2016 | ||||
| 410-1 Security personnel trained in human rights policies or procedures | 76-77 | Principles 1,2 | SDG 3,8 | |
| GRI 411: Rights of Indigenous Peoples 2016 | ||||
| 411-1 Incidents of violations involving rights of indigenous peoples | 89 | Principles 1,2 | SDG 8,11,17 | |
Report page 103
| GRI standard | Disclosure | Page number(s) | Global Compact principles | UN SDGs |
|---|---|---|---|---|
| GRI 413: LOCAL COMMUNITIES 2016 | ||||
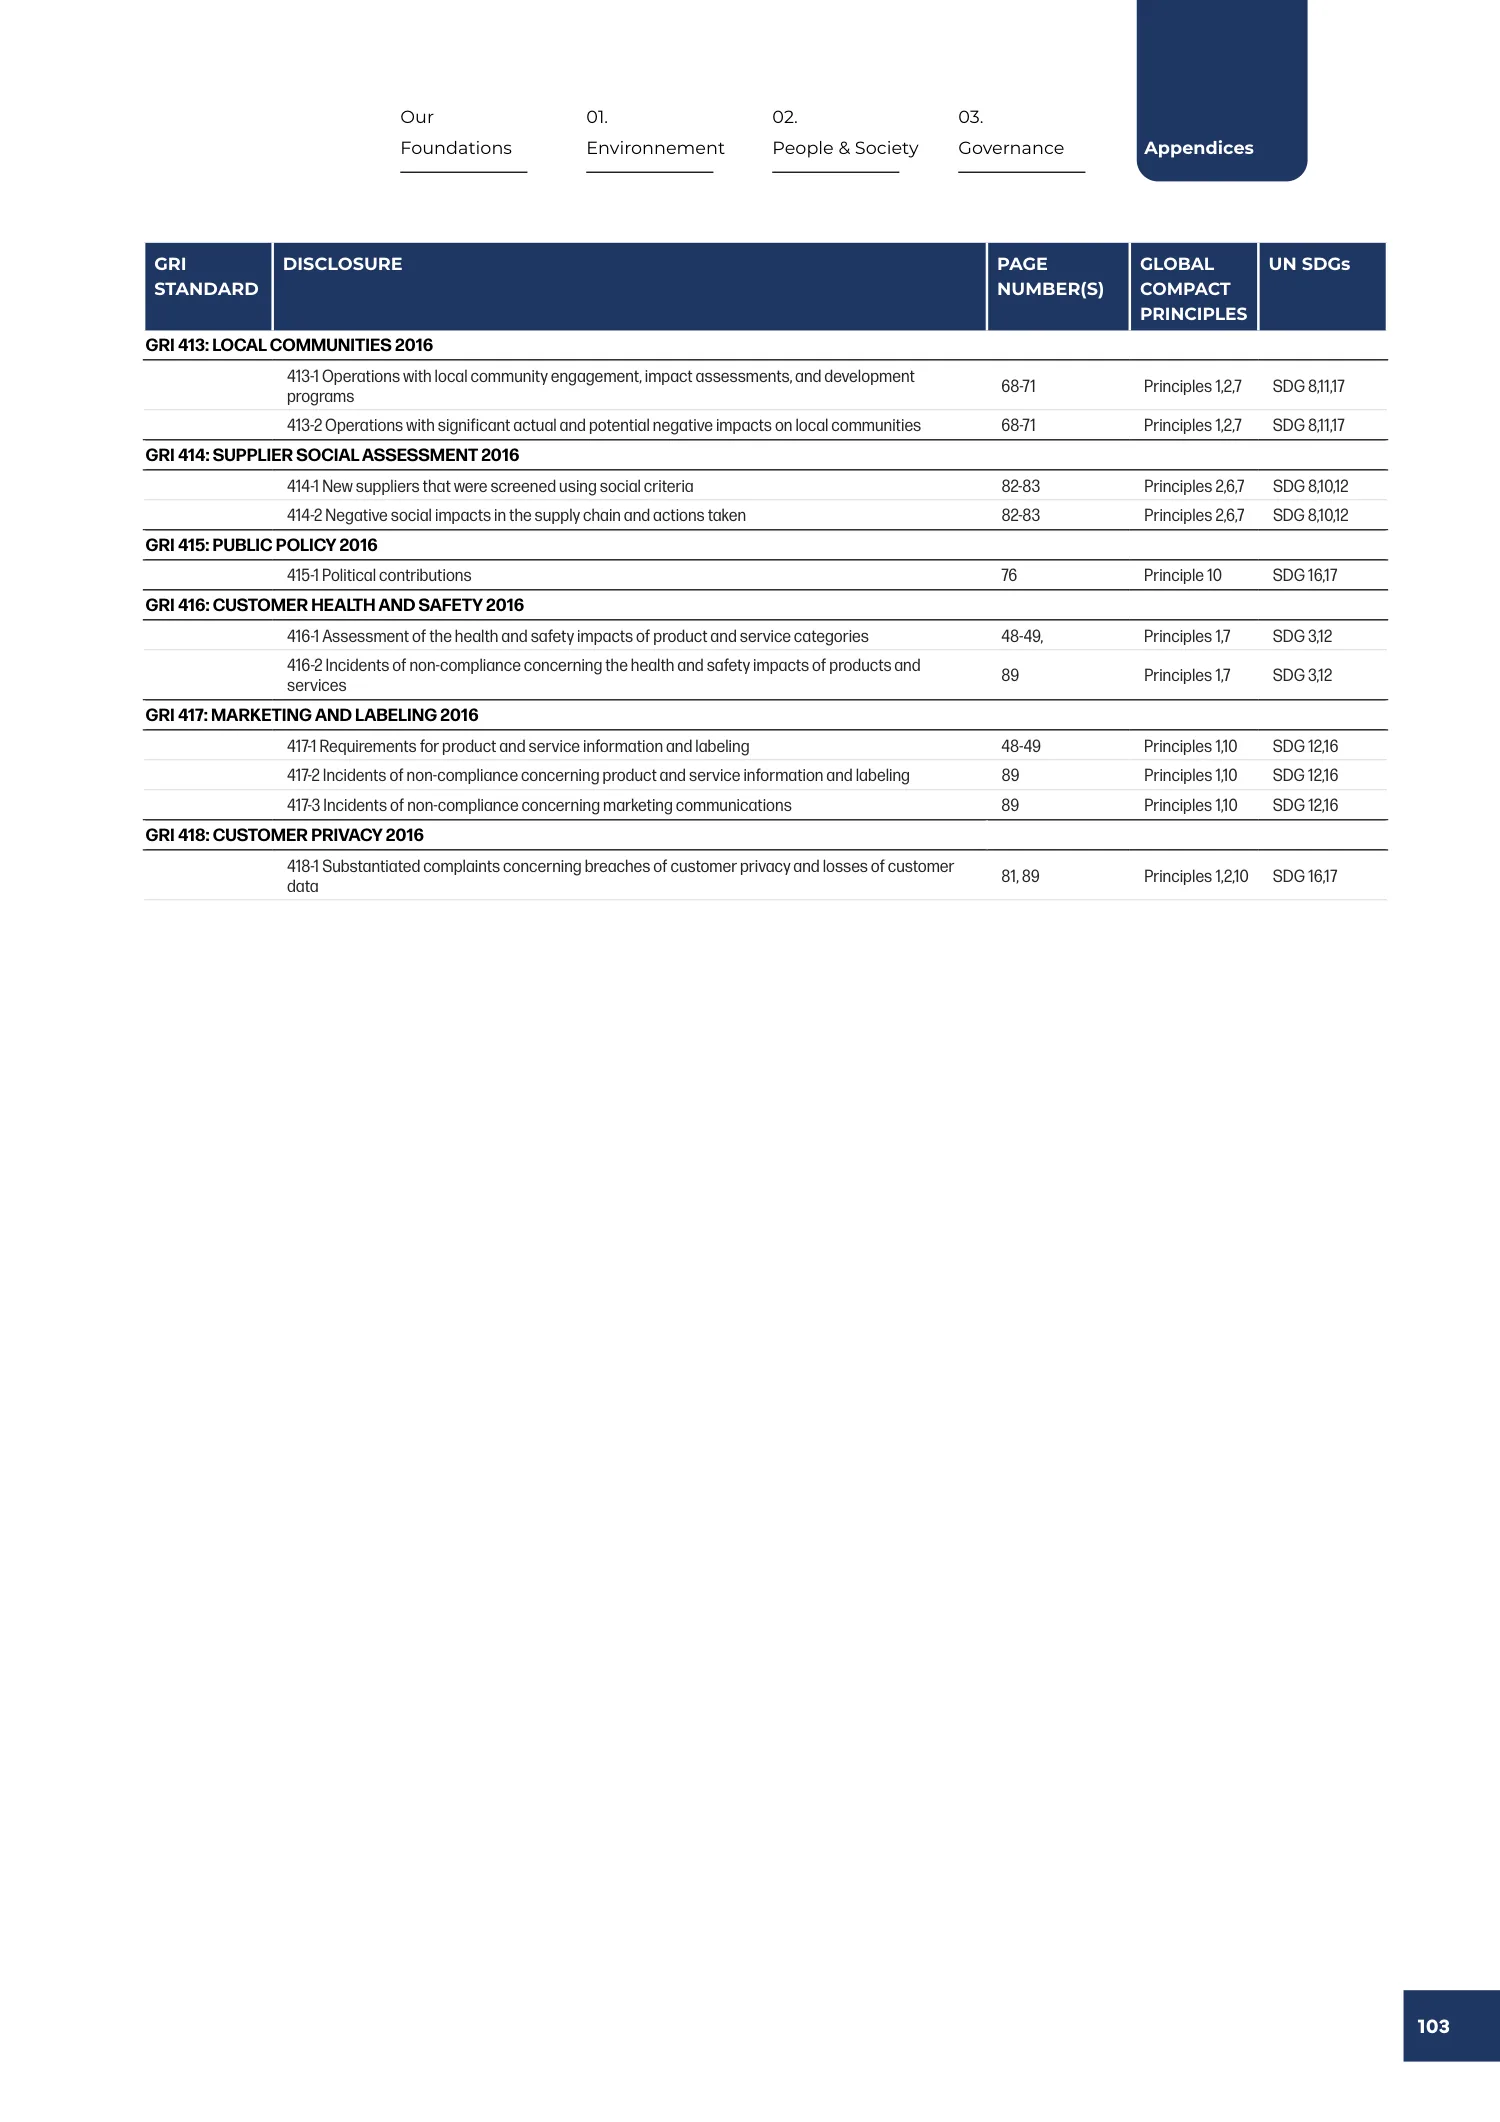
| 413-1 Operations with local community engagement, impact assessments, and development programs | 68-71 | Principles 1,2,7 | SDG 8,11,17 | |
| 413-2 Operations with significant actual and potential negative impacts on local communities | 68-71 | Principles 1,2,7 | SDG 8,11,17 | |
| GRI 414: SUPPLIER SOCIAL ASSESSMENT 2016 | ||||
| 414-1 New suppliers that were screened using social criteria | 82-83 | Principles 2,6,7 | SDG 8,10,12 | |
| 414-2 Negative social impacts in the supply chain and actions taken | 82-83 | Principles 2,6,7 | SDG 8,10,12 | |
| GRI 415: PUBLIC POLICY 2016 | ||||
| 415-1 Political contributions | 76 | Principle 10 | SDG 16,17 | |
| GRI 416: CUSTOMER HEALTH AND SAFETY 2016 | ||||
| 416-1 Assessment of the health and safety impacts of product and service categories | 48-49, | Principles 1,7 | SDG 3,12 | |
| 416-2 Incidents of non-compliance concerning the health and safety impacts of products and services | 89 | Principles 1,7 | SDG 3,12 | |
| GRI 417: MARKETING AND LABELING 2016 | ||||
| 417-1 Requirements for product and service information and labeling | 48-49 | Principles 1,10 | SDG 12,16 | |
| 417-2 Incidents of non-compliance concerning product and service information and labeling | 89 | Principles 1,10 | SDG 12,16 | |
| 417-3 Incidents of non-compliance concerning marketing communications | 89 | Principles 1,10 | SDG 12,16 | |
| GRI 418: CUSTOMER PRIVACY 2016 | ||||
| 418-1 Substantiated complaints concerning breaches of customer privacy and losses of customer data | 81, 89 | Principles 1,2,10 | SDG 16,17 | |
4 pagesIndependent Limited Assurance Report
The independent assurance report describes the responsibilities of SNF and the statutory auditor, the applicable professional guidance, the work performed, and the resulting limited-assurance conclusion. It provides external review of selected consolidated non-financial information and reporting processes.
Accessible text version of this section
Report page 104
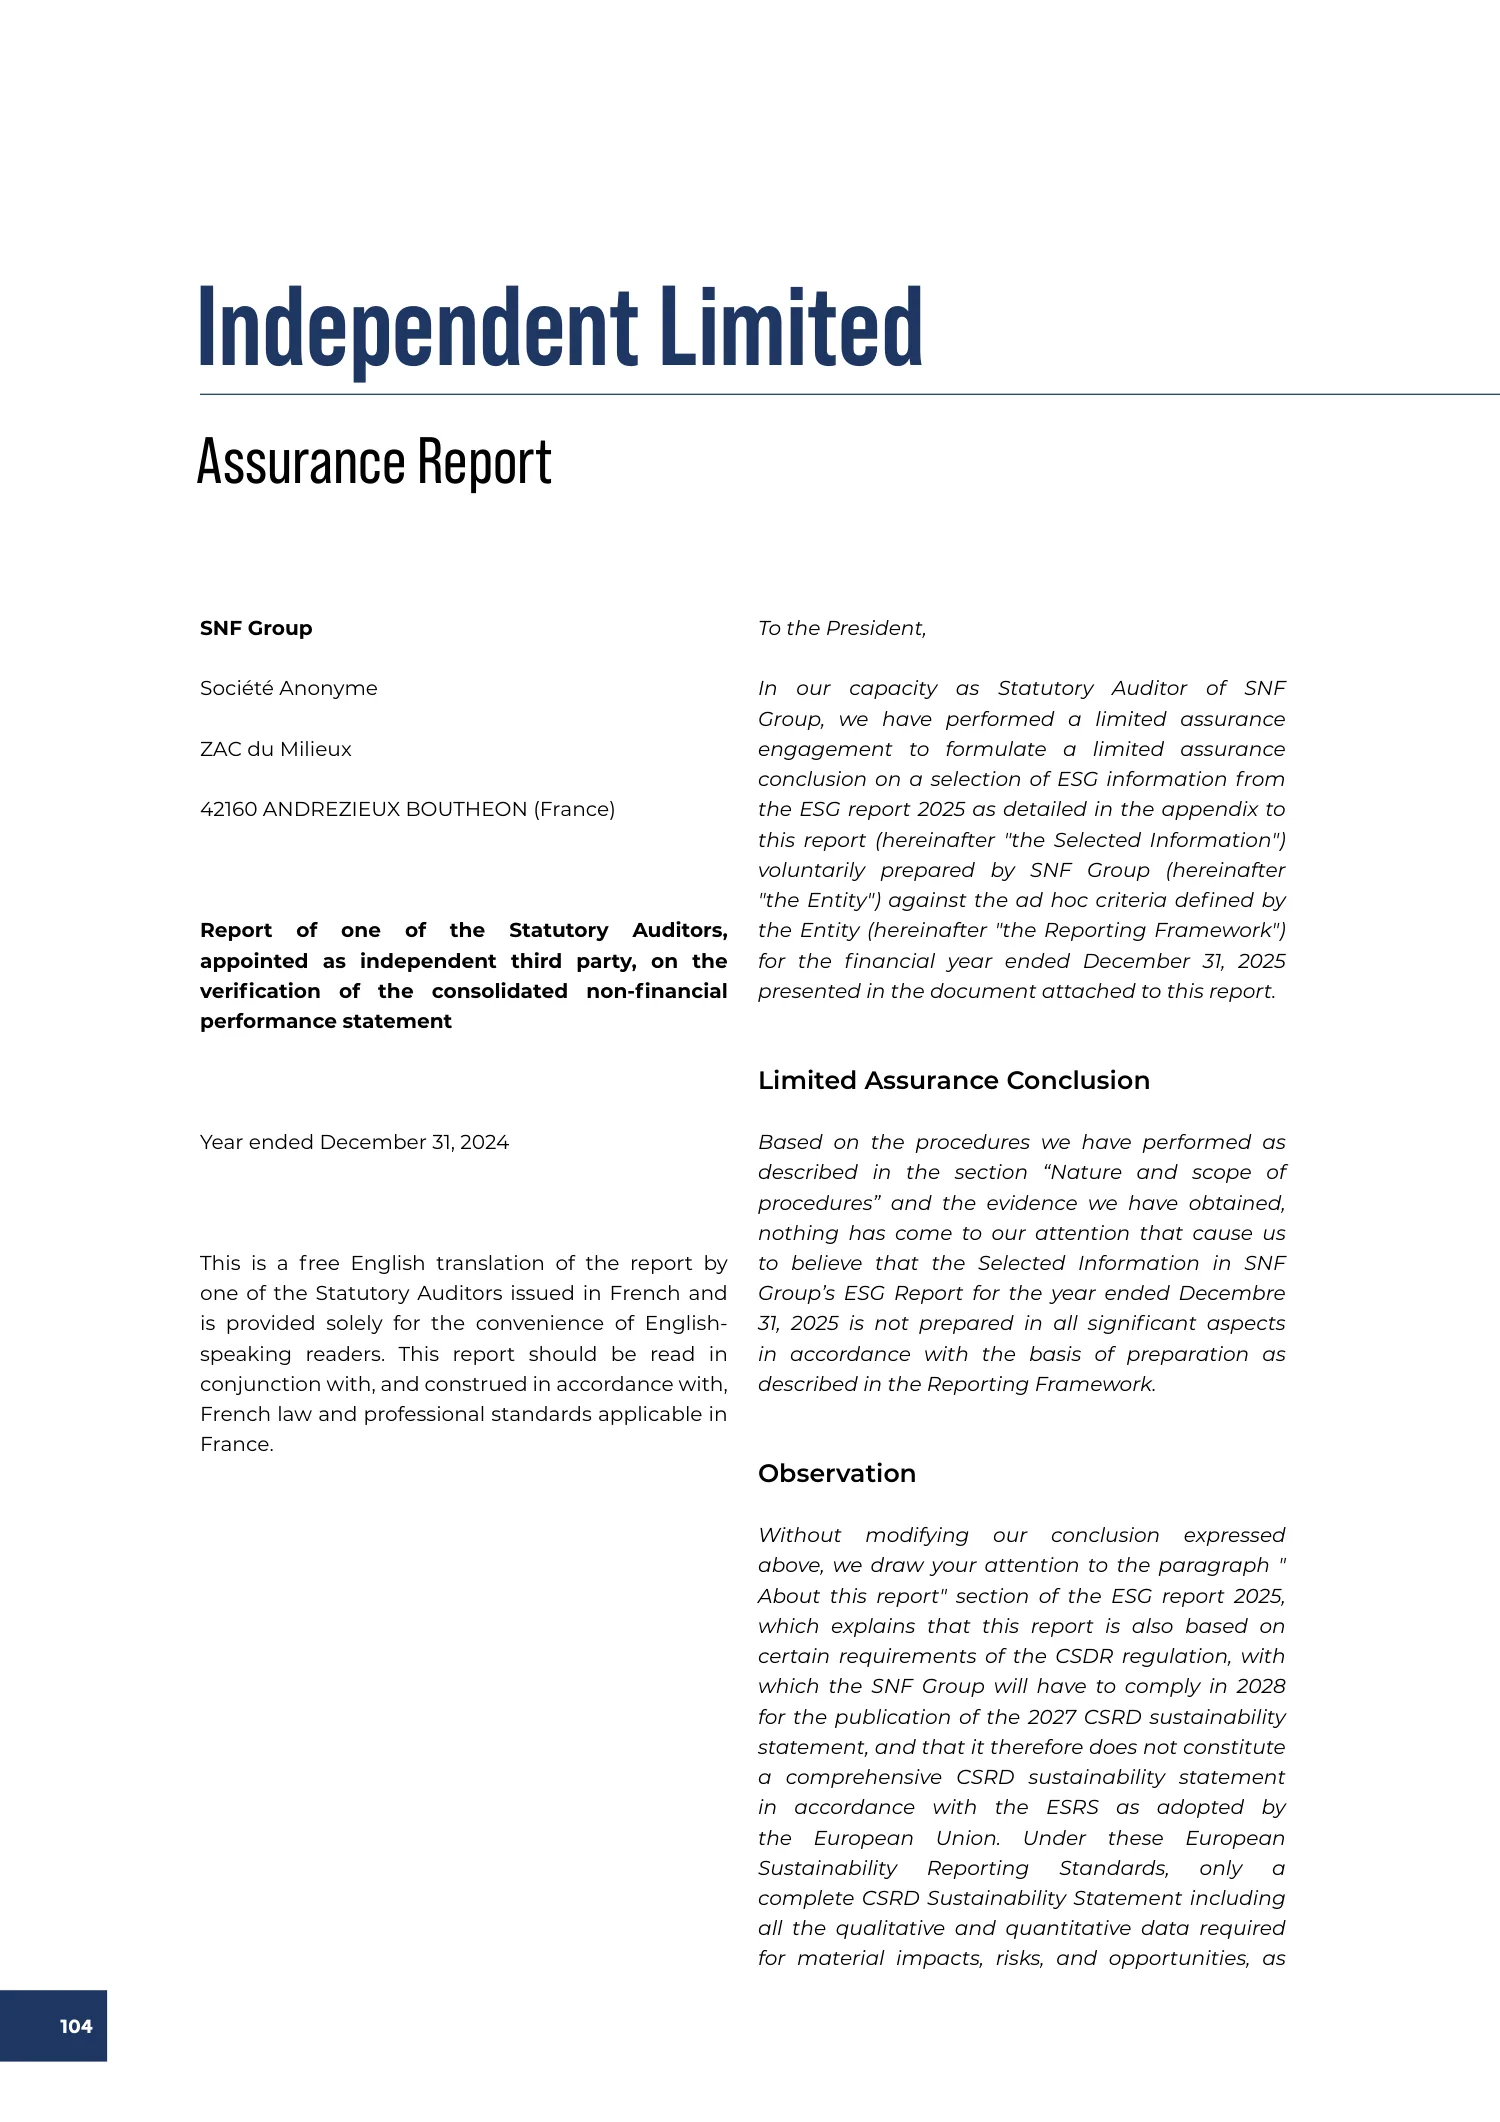
Independent Limited
Assurance Report
SNF Group
Société Anonyme
ZAC du Milieux
42160 ANDREZIEUX BOUTHEON (France)
Report of one of the Statutory Auditors, appointed as independent third party, on the verification of the consolidated non-financial performance statement
Year ended December 31, 2024
This is a free English translation of the report by one of the Statutory Auditors issued in French and is provided solely for the convenience of English-speaking readers. This report should be read in conjunction with, and construed in accordance with, French law and professional standards applicable in France.
To the President,
In our capacity as Statutory Auditor of SNF Group, we have performed a limited assurance engagement to formulate a limited assurance conclusion on a selection of ESG information from the ESG report 2025 as detailed in the appendix to this report (hereinafter "the Selected Information") voluntarily prepared by SNF Group (hereinafter "the Entity") against the ad hoc criteria defined by the Entity (hereinafter "the Reporting Framework") for the financial year ended December 31, 2025 presented in the document attached to this report.
Limited Assurance Conclusion
Based on the procedures we have performed as described in the section “Nature and scope of procedures” and the evidence we have obtained, nothing has come to our attention that cause us to believe that the Selected Information in SNF Group’s ESG Report for the year ended Decembre 31, 2025 is not prepared in all significant aspects in accordance with the basis of preparation as described in the Reporting Framework.
Observation
Without modifying our conclusion expressed above, we draw your attention to the paragraph " About this report" section of the ESG report 2025, which explains that this report is also based on certain requirements of the CSDR regulation, with which the SNF Group will have to comply in 2028 for the publication of the 2027 CSRD sustainability statement, and that it therefore does not constitute a comprehensive CSRD sustainability statement in accordance with the ESRS as adopted by the European Union. Under these European Sustainability Reporting Standards, only a complete CSRD Sustainability Statement including all the qualitative and quantitative data required for material impacts, risks, and opportunities, as
Report page 105
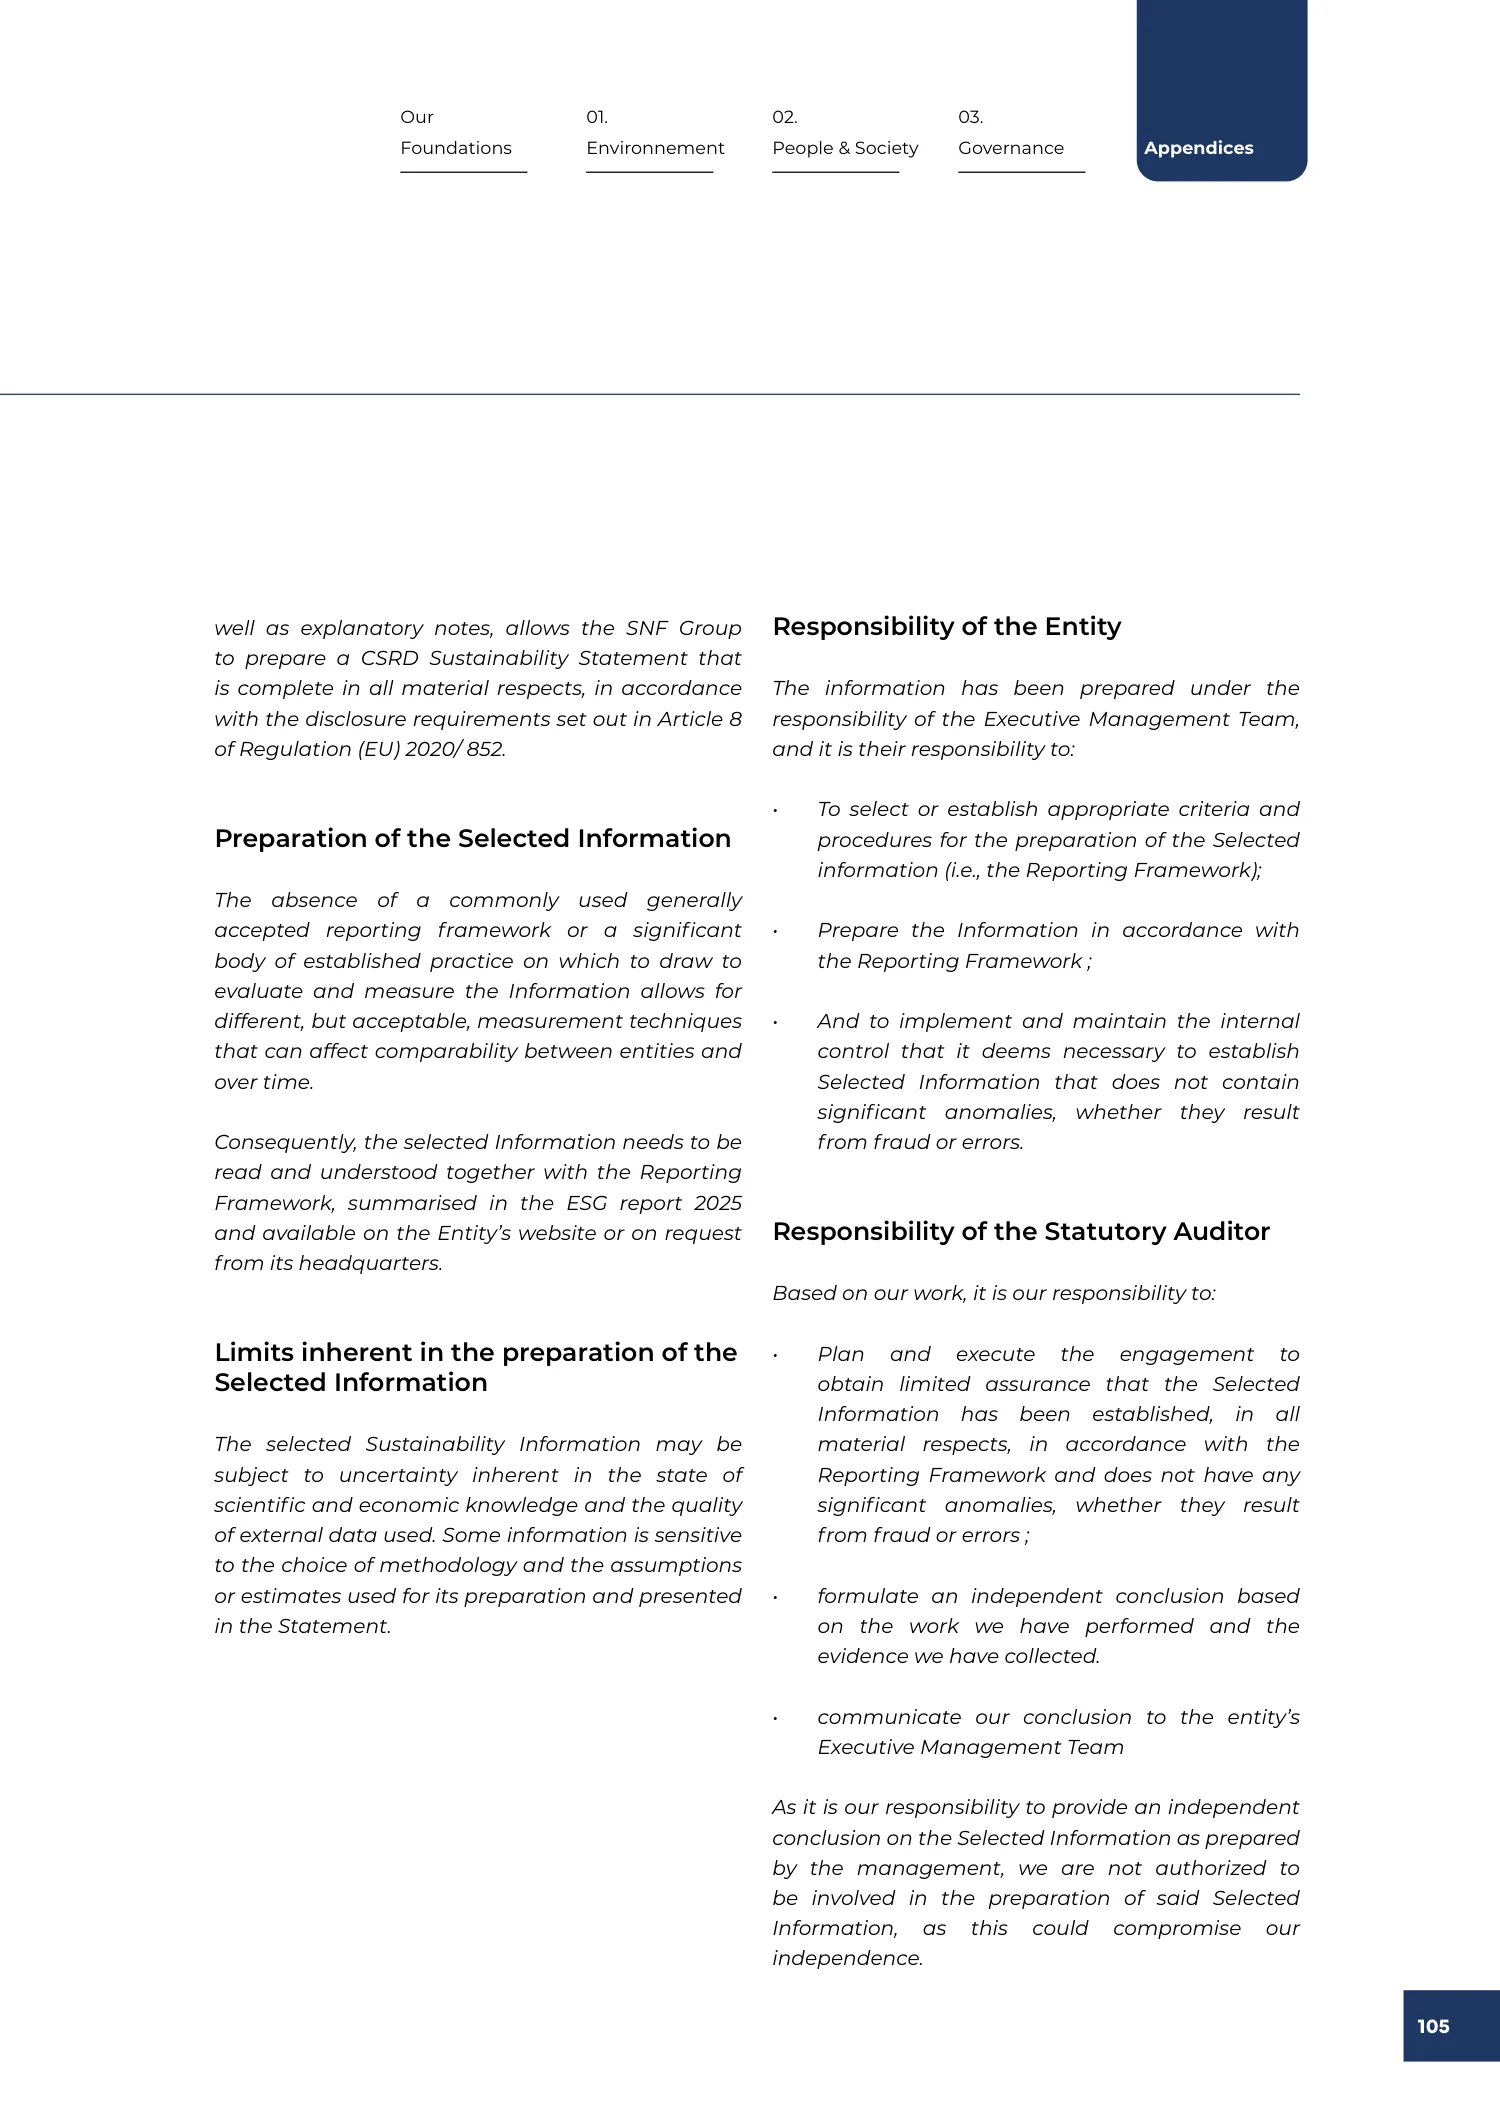
well as explanatory notes, allows the SNF Group to prepare a CSRD Sustainability Statement that is complete in all material respects, in accordance with the disclosure requirements set out in Article 8 of Regulation (EU) 2020/ 852.
Preparation of the Selected Information
The absence of a commonly used generally accepted reporting framework or a significant body of established practice on which to draw to evaluate and measure the Information allows for different, but acceptable, measurement techniques that can affect comparability between entities and over time.
Consequently, the selected Information needs to be read and understood together with the Reporting Framework, summarised in the ESG report 2025 and available on the Entity’s website or on request from its headquarters.
Limits inherent in the preparation of the Selected Information
The selected Sustainability Information may be subject to uncertainty inherent in the state of scientific and economic knowledge and the quality of external data used. Some information is sensitive to the choice of methodology and the assumptions or estimates used for its preparation and presented in the Statement.
Responsibility of the Entity
The information has been prepared under the responsibility of the Executive Management Team, and it is their responsibility to:
• To select or establish appropriate criteria and procedures for the preparation of the Selected information (i.e., the Reporting Framework);
• Prepare the Information in accordance with the Reporting Framework ;
• And to implement and maintain the internal control that it deems necessary to establish Selected Information that does not contain significant anomalies, whether they result from fraud or errors.
Responsibility of the Statutory Auditor
Based on our work, it is our responsibility to:
• Plan and execute the engagement to obtain limited assurance that the Selected Information has been established, in all material respects, in accordance with the Reporting Framework and does not have any significant anomalies, whether they result from fraud or errors ;
• formulate an independent conclusion based on the work we have performed and the evidence we have collected.
• communicate our conclusion to the entity’s Executive Management Team
As it is our responsibility to provide an independent conclusion on the Selected Information as prepared by the management, we are not authorized to be involved in the preparation of said Selected Information, as this could compromise our independence.
Report page 106
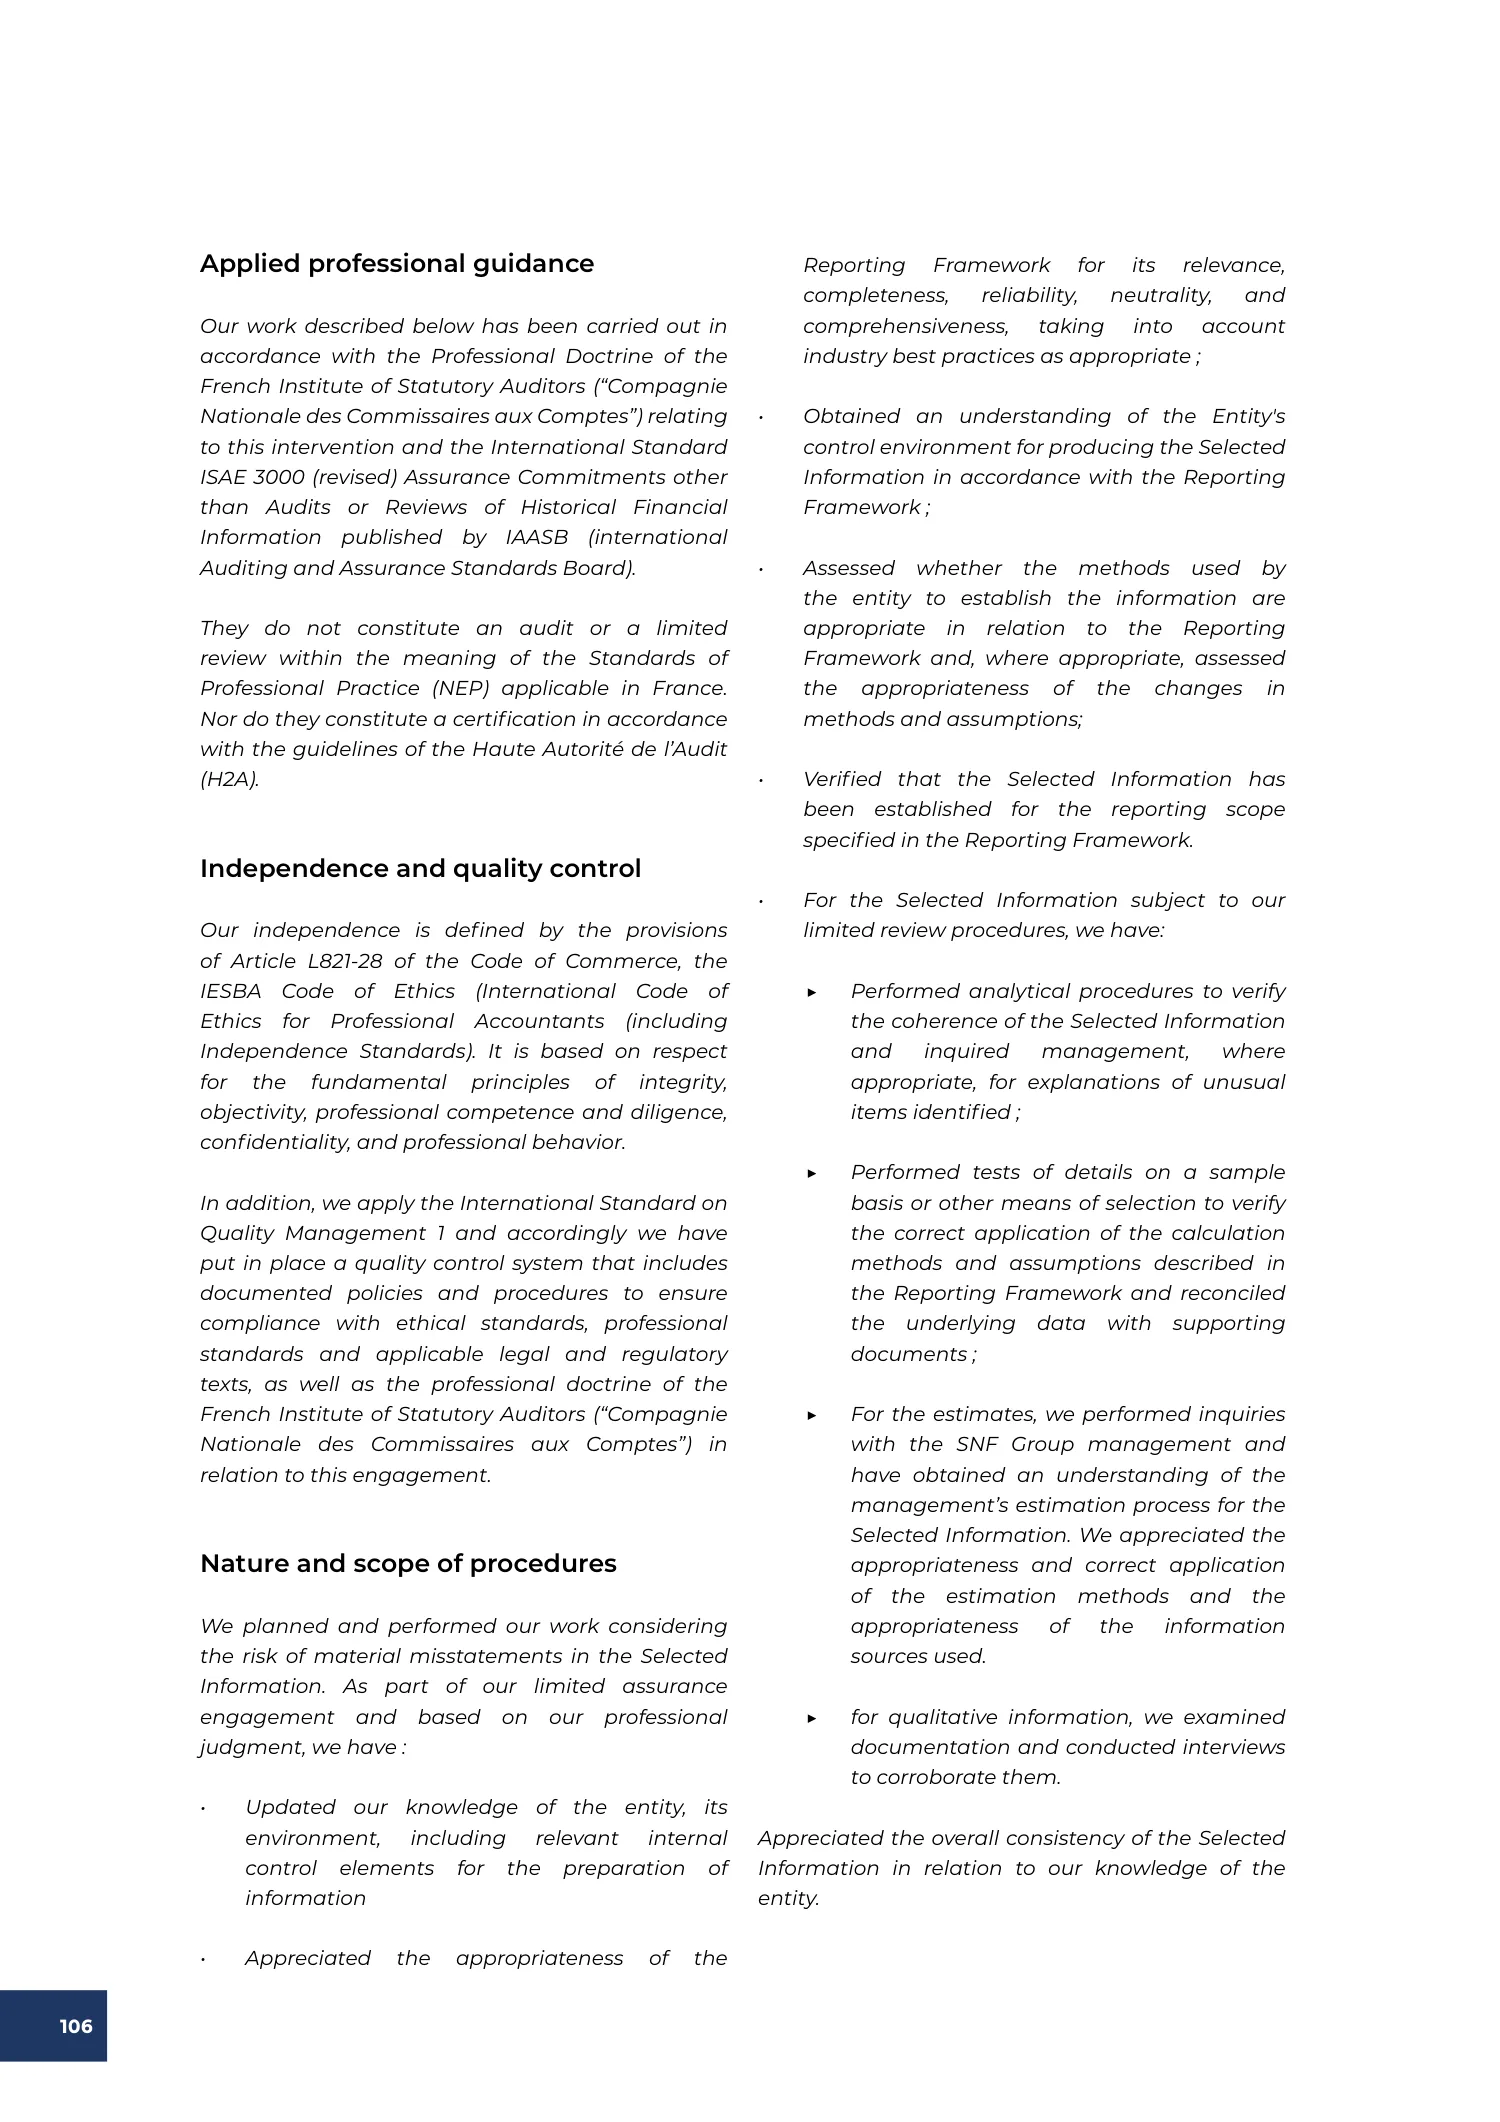
Applied professional guidance
Our work described below has been carried out in accordance with the Professional Doctrine of the French Institute of Statutory Auditors (“Compagnie Nationale des Commissaires aux Comptes”) relating to this intervention and the International Standard ISAE 3000 (revised) Assurance Commitments other than Audits or Reviews of Historical Financial Information published by IAASB (international Auditing and Assurance Standards Board).
They do not constitute an audit or a limited review within the meaning of the Standards of Professional Practice (NEP) applicable in France. Nor do they constitute a certification in accordance with the guidelines of the Haute Autorité de l’Audit (H2A).
Independence and quality control
Our independence is defined by the provisions of Article L821-28 of the Code of Commerce, the IESBA Code of Ethics (International Code of Ethics for Professional Accountants (including Independence Standards). It is based on respect for the fundamental principles of integrity, objectivity, professional competence and diligence, confidentiality, and professional behavior.
In addition, we apply the International Standard on Quality Management 1 and accordingly we have put in place a quality control system that includes documented policies and procedures to ensure compliance with ethical standards, professional standards and applicable legal and regulatory texts, as well as the professional doctrine of the French Institute of Statutory Auditors (“Compagnie Nationale des Commissaires aux Comptes”) in relation to this engagement.
Nature and scope of procedures
We planned and performed our work considering the risk of material misstatements in the Selected Information. As part of our limited assurance engagement and based on our professional judgment, we have :
• Updated our knowledge of the entity, its environment, including relevant internal control elements for the preparation of information
• Appreciated the appropriateness of the
Reporting Framework for its relevance, completeness, reliability, neutrality, and comprehensiveness, taking into account industry best practices as appropriate ;
• Obtained an understanding of the Entity's control environment for producing the Selected Information in accordance with the Reporting Framework ;
• Assessed whether the methods used by the entity to establish the information are appropriate in relation to the Reporting Framework and, where appropriate, assessed the appropriateness of the changes in methods and assumptions;
• Verified that the Selected Information has been established for the reporting scope specified in the Reporting Framework.
• For the Selected Information subject to our limited review procedures, we have:
▶ Performed analytical procedures to verify the coherence of the Selected Information and inquired management, where appropriate, for explanations of unusual items identified ;
▶ Performed tests of details on a sample basis or other means of selection to verify the correct application of the calculation methods and assumptions described in the Reporting Framework and reconciled the underlying data with supporting documents ;
▶ For the estimates, we performed inquiries with the SNF Group management and have obtained an understanding of the management’s estimation process for the Selected Information. We appreciated the appropriateness and correct application of the estimation methods and the appropriateness of the information sources used.
▶ for qualitative information, we examined documentation and conducted interviews to corroborate them.
Appreciated the overall consistency of the Selected Information in relation to our knowledge of the entity.
Report page 107
We believe that the evidence we have collected is sufficient and appropriate to formulate our conclusion.
The procedures performed as part of a limited assurance engagement are less extensive than those required for a reasonable assurance engagement conducted in accordance with the professional standards of the French Institute of Statutory Auditors (“Compagnie Nationale des Commissaires aux Comptes”); a higher level of assurance would have required more extensive verification work.
Restrictions on use
The due care implemented to prepare this report is not intended to replace the investigations and due diligence that third parties who have been communicated this report could also implement, and we do not express an opinion on whether our due care exercised is sufficient for their own needs.
As Statutory Auditor of SNF Group, our responsibility to SNF Group and its shareholders is defined by French law, and we do not accept an extension of our responsibility beyond that provided by French law. We are not liable or accept any liability to any third party. We shall not be liable for any damage, loss, cost, or expense resulting from a dolosive behavior or fraud committed by the board of directors, Executive Management, or employees of SNF Group or its subsidiaries.
This report is governed by French law. The French courts have exclusive jurisdiction over any dispute, claim, or dispute arising out of our Engagement letter or this report, or any matter relating thereto.
Lyon, March 6, 2026
One of the Statutory Auditors,
Deloitte & Associates
Josselin Vernay
Partner, Audit & Assurance
1 pageClosing Cover
The report closes with SNF's Water Science identity and corporate website address. Readers can continue to www.snf.com for current information about the Group, its markets, and its sustainability activities.

Accessible text version of this section
Report page 110
www.snf.com